 by
by Lines of Regression
The Regression Line is the line that best fits the data, such that the overall distance from the line to the points (variable values) plotted on a graph is the smallest. In other words, a line used to minimize the squared deviations of predictions is called as the regression line.
There are as many numbers of regression lines as variables. Suppose we take two variables, say X and Y, then there will be two regression lines:
- Regression line of Y on X:This gives the most probable values of Y from the given values of X.
- Regression line of X on Y:This gives the most probable values of X from the given values of Y.
The algebraic expression of these regression lines is called as Regression Equations. There will be two regression equations for the two regression lines.
The correlation between the variables depend on the distance between these two regression lines, such as the nearer the regression lines to each other the higher is the degree of correlation, and the farther the regression lines to each other the lesser is the degree of correlation.
The correlation is said to be either perfect positive or perfect negative when the two regression lines coincide, i.e. only one line exists. In case, the variables are independent; then the correlation will be zero, and the lines of regression will be at right angles, i.e. parallel to the X axis and Y axis.
The regression lines cut each other at the point of average of X and Y. This means, from the point where the lines intersect each other the perpendicular is drawn on the X axis we will get the mean value of X. Similarly, if the horizontal line is drawn on the Y axis we will get the mean value of Y.
The two basic types of regression are linear regression and multiple linear regressions, although there are non-linear regression methods for more complicated data and analysis. Linear regression uses one independent variable to explain or predict the outcome of the dependent variable Y, while multiple regressions use two or more independent variables to predict the outcome.
Regression can help finance and investment professionals as well as professionals in other businesses. Regression can also help predict sales for a company based on weather, previous sales, GDP growth or other types of conditions. The capital asset pricing model (CAPM) is an often-used regression model in finance for pricing assets and discovering costs of capital.
The general form of each type of regression is:
- Linear regression: Y = a + bX + u
- Multiple regression: Y = a + b1X1 + b2X2 + b3X3 + … + btXt + u
Where:
Y = the variable that you are trying to predict (dependent variable).
X = the variable that you are using to predict Y (independent variable).
a = the intercept.
b = the slope.
u = the regression residual.
Regression takes a group of random variables, thought to be predicting Y, and tries to find a mathematical relationship between them. This relationship is typically in the form of a straight line (linear regression) that best approximates all the individual data points. In multiple regression, the separate variables are differentiated by using numbers with subscripts.
Assumptions in Regression
- Independence: The residuals are serially independent (no autocorrelation).
- The residuals are not correlated with any of the independent (predictor) variables.
- Linearity: The relationship between the dependent variable and each of the independent variables is linear.
- Mean of Residuals: The mean of the residuals is zero.
- Homogeneity of Variance: The variance of the residuals at all levels of the independent variables is constant.
- Errors in Variables: The independent (predictor) variables are measured without error.
- Model Specification: All relevant variables are included in the model. No irrelevant variables are included in the model.
- Normality: The residuals are normally distributed. This assumption is needed for valid tests of significance but not for estimation of the regression coefficients.
Uses
Three major uses for regression analysis are
(1) Determining the strength of predictors
(2) Forecasting an effect
(3) Trend forecasting.
First, the regression might be used to identify the strength of the effect that the independent variable(s) have on a dependent variable. Typical questions are what is the strength of relationship between dose and effect, sales and marketing spending, or age and income.
Second, it can be used to forecast effects or impact of changes. That is, the regression analysis helps us to understand how much the dependent variable changes with a change in one or more independent variables. A typical question is, “how much additional sales income do I get for each additional $1000 spent on marketing?”
Third, regression analysis predicts trends and future values. The regression analysis can be used to get point estimates. A typical question is, “what will the price of gold be in 6 months?”
Co-efficient of regression
The Regression Coefficient is the constant ‘b’ in the regression equation that tells about the change in the value of dependent variable corresponding to the unit change in the independent variable.
If there are two regression equations, then there will be two regression coefficients:
Regression Coefficient of X on Y: The regression coefficient of X on Y is represented by the symbol bxy that measures the change in X for the unit change in Y. Symbolically, it can be represented as:
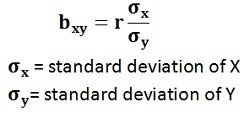
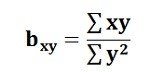
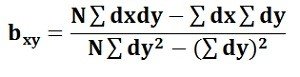
The bxy can be obtained by using the following formula when the deviations are taken from the actual means of X and Y:When the deviations are obtained from the assumed mean, the following formula is used:
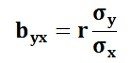
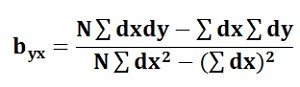
Regression Coefficient of Y on X: The symbol byx is used that measures the change in Y corresponding to the unit change in X. Symbolically, it can be represented as:
In case, the deviations are taken from the actual means; the following formula is used:
The byx can be calculated by using the following formula when the deviations are taken from the assumed means:

The Regression Coefficient is also called as a slope coefficient because it determines the slope of the line i.e. the change in the independent variable for the unit change in the independent variable
One thought on “Regression Analysis: Linear regression, Regression lines, Regression equations”