 by
by Regression analysis is a statistical method used to examine the relationship between one dependent variable and one or more independent variables. It helps to predict the value of the dependent variable based on the values of independent variables. The most common form is linear regression, where the relationship is assumed to be linear.
In simple terms, regression analysis allows us to answer questions like: “If advertising increases, how much will sales rise?” or “How does education level impact income?” It quantifies relationships in the form of a mathematical equation, such as:
Y = a + bX
Where:
-
Y is the dependent variable,
-
X is the independent variable,
-
a is the intercept, and
-
b is the slope or regression coefficient.
Regression analysis is widely used in business, economics, healthcare, social sciences, and engineering. It helps in forecasting, identifying trends, and making informed decisions. It also plays a key role in evaluating the strength and direction of relationships between variables, testing hypotheses, and validating models.
Regression
Regression is a statistical technique that examines the relationship between two or more variables, particularly to predict the value of one variable (dependent) based on the value(s) of other variable(s) (independent). It shows how the dependent variable changes when the independent variable varies.
Lines of Regression
The Regression Line is the line that best fits the data, such that the overall distance from the line to the points (variable values) plotted on a graph is the smallest. In other words, a line used to minimize the squared deviations of predictions is called as the regression line.
Regression Equations
Regression equations are mathematical models used to describe the relationship between two or more variables. They help in predicting the value of one variable (dependent) based on the known value of another (independent).
There are as many numbers of regression lines as variables. Suppose we take two variables, say X and Y, then there will be two regression lines:
- Regression line of Y on X:This gives the most probable values of Y from the given values of X.
- Regression line of X on Y:This gives the most probable values of X from the given values of Y.
The algebraic expression of these regression lines is called as Regression Equations. There will be two regression equations for the two regression lines.
The correlation between the variables depend on the distance between these two regression lines, such as the nearer the regression lines to each other the higher is the degree of correlation, and the farther the regression lines to each other the lesser is the degree of correlation.
The correlation is said to be either perfect positive or perfect negative when the two regression lines coincide, i.e. only one line exists. In case, the variables are independent; then the correlation will be zero, and the lines of regression will be at right angles, i.e. parallel to the X axis and Y axis.
The regression lines cut each other at the point of average of X and Y. This means, from the point where the lines intersect each other the perpendicular is drawn on the X axis we will get the mean value of X. Similarly, if the horizontal line is drawn on the Y axis we will get the mean value of Y.
The two basic types of regression are linear regression and multiple linear regressions, although there are non-linear regression methods for more complicated data and analysis. Linear regression uses one independent variable to explain or predict the outcome of the dependent variable Y, while multiple regressions use two or more independent variables to predict the outcome.
Regression can help finance and investment professionals as well as professionals in other businesses. Regression can also help predict sales for a company based on weather, previous sales, GDP growth or other types of conditions. The capital asset pricing model (CAPM) is an often-used regression model in finance for pricing assets and discovering costs of capital.
The general form of each type of regression is:
- Linear regression: Y = a + bX + u
- Multiple regression: Y = a + b1X1 + b2X2 + b3X3 + … + btXt + u
Where:
Y = the variable that you are trying to predict (dependent variable).
X = the variable that you are using to predict Y (independent variable).
a = the intercept.
b = the slope.
u = the regression residual.
Regression takes a group of random variables, thought to be predicting Y, and tries to find a mathematical relationship between them. This relationship is typically in the form of a straight line (linear regression) that best approximates all the individual data points. In multiple regression, the separate variables are differentiated by using numbers with subscripts.
Assumptions in Regression:
- Linearity of Relationship
Regression assumes that there is a linear relationship between the independent variable(s) and the dependent variable. This means changes in the independent variable produce proportional changes in the dependent variable. If the relationship is non-linear, linear regression may yield inaccurate predictions, and transformations or non-linear models should be considered instead.
- Independence of Observations
It is assumed that the observations or residuals are independent of each other, meaning the value of one data point should not influence another. This is especially important in time series data. If this assumption is violated, it can result in misleading conclusions, especially when using regression to forecast future outcomes.
- Homoscedasticity
Homoscedasticity refers to the assumption that the variance of residuals (errors) is constant across all levels of the independent variables. If residuals display increasing or decreasing spread, it indicates heteroscedasticity. This can bias standard errors and affect confidence intervals and hypothesis tests, making model results unreliable.
- No Perfect Multicollinearity
In multiple regression, it is assumed that the independent variables are not perfectly correlated with each other. Perfect multicollinearity makes it impossible to isolate the individual effect of each variable on the dependent variable. It leads to unstable coefficient estimates and makes interpretation difficult.
- Normality of Residuals
It is assumed that the residuals (differences between observed and predicted values) are normally distributed. This is important for making valid statistical inferences, especially for calculating p-values and confidence intervals. A histogram or Q-Q plot of residuals is commonly used to test this assumption in practical analysis.
- Fixed Independent Variables
Regression assumes that the independent variables are fixed or measured without error. In other words, the X-values are considered constants and not influenced by random variations. If the independent variables contain measurement errors, it can reduce the reliability of regression estimates and weaken the model’s predictive accuracy.
- Additivity of Relationship
In multiple regression, the assumption is that the effect of each independent variable on the dependent variable is additive. That is, the overall effect is the sum of the individual effects. Interaction terms may be added to the model if variables jointly influence the dependent variable in a non-additive way.
- No Autocorrelation
In regression involving time series data, it is assumed that residuals are not autocorrelated, meaning one residual is not correlated with another. Violation of this assumption leads to biased standard errors, affecting the validity of hypothesis tests. Tools like the Durbin-Watson test help detect autocorrelation in residuals.
Uses of regression analysis:
- Forecasting and Prediction
Regression analysis is widely used to forecast future values based on historical data. For example, businesses predict future sales, revenue, or customer demand by analyzing past trends. It helps in strategic planning by estimating outcomes under various scenarios, making it a vital tool for financial planning, production scheduling, and inventory management.
- Evaluating Relationships Between Variables
Regression helps understand the nature and strength of relationships between variables. For instance, it can show how advertising expenditure influences sales, or how income affects consumer spending. This insight is crucial for decision-making and resource allocation in both business and research environments where variable interdependence matters.
- Business and Economic Research
In economics and business studies, regression models help examine relationships such as the effect of interest rates on investment, or inflation on purchasing power. These analyses support policymaking and strategy development by offering empirical support for theories and assumptions used in economic modeling and market studies.
- Human Resource Planning
Organizations use regression to analyze how factors like experience, education, and training influence employee performance or salary. This helps HR departments in workforce planning, compensation structuring, and identifying skill gaps. Regression aids in making evidence-based decisions regarding hiring, promotions, and training programs.
- Quality Control and Production Analysis
In manufacturing and quality control, regression analysis helps in identifying how production variables affect product quality. It’s used to monitor and improve processes by evaluating how inputs like temperature, pressure, or raw material properties impact the output, thereby enhancing efficiency and reducing defects.
- Marketing Strategy Development
Regression models help marketers assess how changes in pricing, advertising, or distribution influence consumer behavior. It is used to estimate price elasticity, brand loyalty, and the effect of promotional strategies. These insights guide budget allocation, campaign design, and overall marketing effectiveness.
- Medical and Social Research
In medical studies, regression is used to identify relationships between risk factors and health outcomes, like how smoking influences lung cancer incidence. Social scientists use it to understand trends and patterns in education, crime rates, or income inequality, allowing data-driven policy formulation and impact assessment.
- Financial Risk Assessment
Regression analysis is essential in finance for modeling the relationship between risk and return, or to estimate the impact of macroeconomic factors on a company’s financial performance. It aids in portfolio optimization, credit risk analysis, and investment decision-making by predicting financial behavior under varying market conditions.
Co-efficient of regression
The Regression Coefficient is the constant ‘b’ in the regression equation that tells about the change in the value of dependent variable corresponding to the unit change in the independent variable.
If there are two regression equations, then there will be two regression coefficients:
Regression Coefficient of X on Y: The regression coefficient of X on Y is represented by the symbol bxy that measures the change in X for the unit change in Y. Symbolically, it can be represented as:
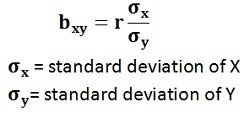
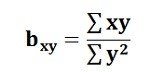
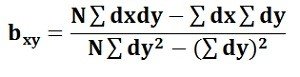
The bxy can be obtained by using the following formula when the deviations are taken from the actual means of X and Y:When the deviations are obtained from the assumed mean, the following formula is used:
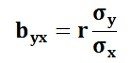
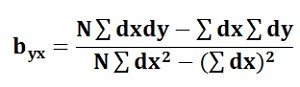
Regression Coefficient of Y on X: The symbol byx is used that measures the change in Y corresponding to the unit change in X. Symbolically, it can be represented as:
In case, the deviations are taken from the actual means; the following formula is used:
The byx can be calculated by using the following formula when the deviations are taken from the assumed means:

The Regression Coefficient is also called as a slope coefficient because it determines the slope of the line i.e. the change in the independent variable for the unit change in the independent variable
2 thoughts on “Regression Analysis, Linear regression, Regression lines, Regression Equations”