 by
by The term structure of interest rates refers to the relationship between the time to maturity of a debt instrument and its corresponding yield or interest rate, assuming all other characteristics such as credit risk, tax treatment, and liquidity are identical. It is most commonly represented by the yield curve, which plots yields on the vertical axis against maturities on the horizontal axis, typically using government securities as the benchmark. The term structure provides a snapshot of market expectations regarding future interest rates, inflation, and economic activity. It is not static; its shape changes over time, ranging from normal (upward-sloping) to flat or inverted (downward-sloping). Financial market participants, including banks, corporate treasurers, portfolio managers, and central banks, use the term structure to price bonds, structure loans, manage interest rate risk, and formulate monetary policy.
Yield Curve Concept
The yield curve is a graphical representation of the term structure, plotting yields on the vertical axis against time to maturity on the horizontal axis. It is most commonly constructed using government securities (like Treasury bills, notes, and bonds) because they are considered risk-free with respect to default. The shape of the yield curve changes over time based on market conditions. A normal or upward-sloping yield curve occurs when long-term rates are higher than short-term rates, compensating investors for increased risk over longer horizons. A flat yield curve occurs when short and long rates are nearly equal, signaling uncertainty. An inverted yield curve (long-term rates below short-term rates) has historically preceded economic recessions, as it indicates expectations of future interest rate cuts by the central bank in response to economic slowdown.
Types of Yield Curve (Normal, Inverted, Flat):
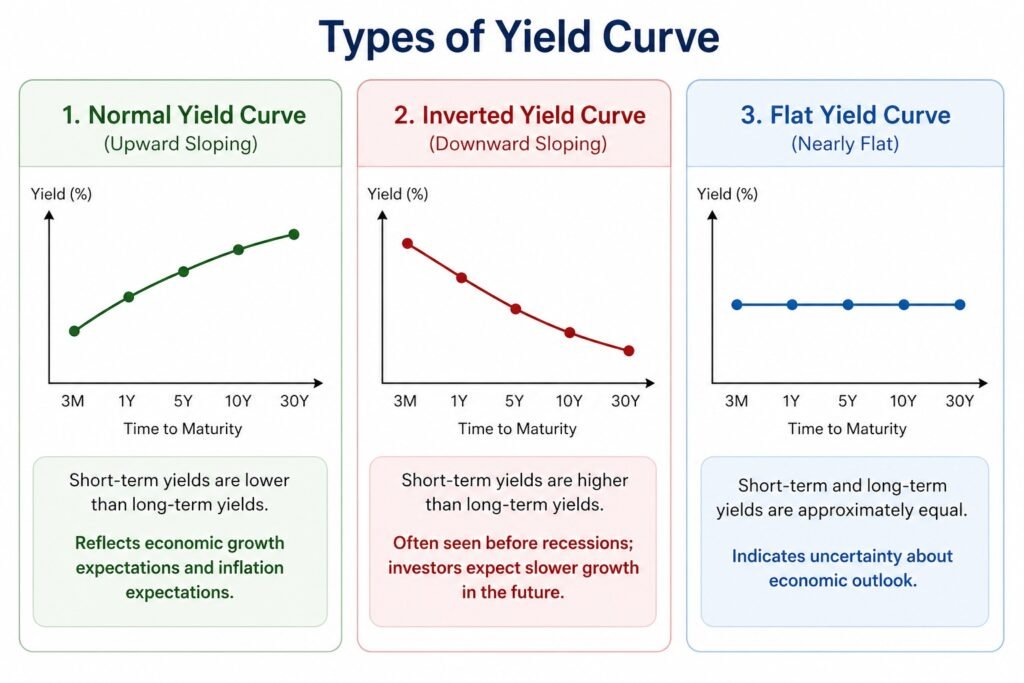
1. Normal Yield Curve (Upward-Sloping)
A normal yield curve slopes upward, meaning short-term interest rates are lower than long-term rates. This is the most common shape and reflects a healthy, growing economy. Investors demand higher yields for longer maturities to compensate for greater risks, including inflation uncertainty, interest rate risk, and the liquidity premium for locking funds for extended periods. Under the expectations theory, an upward slope indicates that markets anticipate future short-term rates to rise due to expected economic expansion and potential monetary policy tightening to control inflation. Lenders and borrowers both prefer this environment: banks can borrow short-term at low rates and lend long-term at high rates (positive carry), supporting profitability. Central banks typically raise policy rates during such phases. A normal curve signals confidence in future growth, with no immediate recession fears. It is the benchmark against which all other yield curve shapes are compared.
2. Inverted Yield Curve (Downward-Sloping)
An inverted yield curve slopes downward, with short-term interest rates higher than long-term rates. This shape is unusual and widely regarded as a reliable predictor of an upcoming economic recession, typically occurring 6 to 18 months ahead. Inversion happens when central banks raise short-term policy rates aggressively to combat high inflation, causing yields on treasury bills and short-term bonds to spike. Simultaneously, long-term rates remain lower due to market expectations of future rate cuts as the economy slows. Investors flock to long-term bonds seeking safety, pushing their prices up and yields down. Inversion compresses bank profit margins because borrowing short-term becomes expensive while lending long-term yields lower returns. Credit availability tightens, investment falls, and consumer spending weakens. Historical inversions in the US and India have often preceded growth slowdowns, making this curve shape a critical warning signal for policymakers and investors.
3. Flat Yield Curve
A flat yield curve occurs when short-term and long-term interest rates are approximately equal, with very little difference across maturities. This shape represents a transitional phase between a normal and an inverted curve, or vice versa. It signals uncertainty in the markets about the future direction of interest rates and the broader economy. A flat curve may emerge when the central bank is in the middle of a tightening cycle, having raised short-term rates significantly, but long-term rates have not yet adjusted downward. Alternatively, it can appear when the economy is shifting from expansion to slowdown, and market participants disagree on whether future rates will rise or fall. For banks, a flat curve reduces the incentive to lend long-term because the spread over borrowing costs is minimal. This often leads to reduced credit growth, cautious business investment, and slower economic activity. Investors typically adopt a wait-and-watch approach during flat curve periods.
Theories of Term Structure:
1. Pure Expectations Theory
The Pure Expectations Theory (also called the Unbiased Expectations Theory) states that long-term interest rates are solely the geometric average of expected future short-term interest rates. According to this theory, an investor holding a long-term bond should earn the same total return as repeatedly investing in a series of short-term bonds over the same period, assuming zero transaction costs and no risk preferences. Therefore, the shape of the yield curve directly reflects market expectations of future monetary policy. An upward-sloping curve indicates that markets expect future short-term rates to rise; a downward-sloping (inverted) curve indicates expected future rate declines; and a flat curve indicates stable rate expectations. The theory assumes investors are indifferent to maturity risk and bonds of different maturities are perfect substitutes. However, empirical evidence shows that long-term rates are consistently higher than what pure expectations would predict, suggesting the presence of additional premiums. Consequently, while useful for understanding market expectations, this theory is rarely observed alone in real markets.
2. Liquidity Preference Theory
The Liquidity Preference Theory, developed by John Maynard Keynes and later refined by Hicks, modifies the Expectations Theory by incorporating investors’ preference for liquidity. It argues that investors prefer short-term, highly liquid securities because they can be converted to cash quickly without significant price volatility or transaction costs. To induce investors to hold longer-term, less liquid bonds, issuers must offer a positive liquidity premium (also called term premium or maturity premium) that increases with the length of maturity. Consequently, long-term yields equal the average of expected future short-term rates plus a rising liquidity premium. This theory explains why the yield curve is typically upward-sloping even when future short-term rates are expected to remain stable or slightly decline. The liquidity premium compensates investors for bearing interest rate risk, inflation uncertainty, and the opportunity cost of locking funds for extended periods. This theory is widely accepted for explaining normal yield curve shapes and is supported by empirical evidence showing that long-term bonds historically yield more than short-term bonds on average.
3. Market Segmentation Theory
The Market Segmentation Theory argues that the term structure is determined by independent supply and demand forces within distinct maturity segments, rather than by expectations of future rates or liquidity premiums. It assumes that different institutional investors have strong preferences for specific maturity ranges based on their liability structures and regulatory constraints. For example, commercial banks prefer short-term securities to match short-term deposits, while life insurance companies and pension funds prefer long-term bonds to match long-term policy liabilities. These investors do not switch between maturity segments even when yields change, because such switching would expose them to unacceptable risk. Therefore, yields in each maturity segment are determined solely by the supply of securities and demand from investors in that segment. The shape of the yield curve depends on whether demand is concentrated in short, intermediate, or long maturities. This theory explains why yield curve segments can sometimes move independently but fails to account for arbitrage opportunities that prevent large price discrepancies across maturities.
4. Preferred Habitat Theory
The Preferred Habitat Theory, proposed by Franco Modigliani and Richard Sutch, is an extension of the Market Segmentation Theory that allows for some investor flexibility across maturity segments. It agrees that investors have preferred maturity habitats based on their liability structures and risk tolerances. However, unlike the pure segmentation theory, it recognizes that investors will move outside their preferred habitat if offered sufficient additional return (a premium) to compensate for the increased risk or discomfort. Therefore, yields are determined by both supply and demand within each segment and by risk premiums that can induce cross-maturity flows. This theory allows the yield curve to be explained by a combination of expectations, liquidity preference, and segmentation forces. It implies that the term structure can change not only due to changing rate expectations but also due to shifting investor preferences or changes in the relative supply of securities across maturities. This is the most realistic and flexible theory, accommodating observed market behavior where investors occasionally shift maturities for yield enhancement.
Uses of Term Structure:
1. Investment Decision Making
The term structure of interest rates helps investors choose suitable investment options based on maturity and returns. By analyzing yield curves, investors can compare short term and long term interest rates. It helps in deciding whether to invest in bonds, government securities, or other financial instruments. A rising or falling yield curve gives signals about future interest rate movements. Investors use this information to maximize returns and reduce risk. Financial institutions also rely on term structure analysis for portfolio management. It plays an important role in making informed and strategic investment decisions in the financial market.
2. Economic Forecasting
The term structure is widely used to predict future economic conditions. Changes in the shape of the yield curve indicate expectations about inflation, growth, and interest rates. For example, an inverted yield curve may signal an upcoming economic slowdown. Economists and policymakers study these patterns to understand market trends. Central banks like the Reserve Bank of India use this information for planning monetary policies. It helps in identifying future risks and opportunities. Thus, the term structure acts as an important tool for economic analysis and forecasting.
3. Monetary Policy Formulation
The term structure of interest rates helps central banks in designing and implementing monetary policy. By analyzing the yield curve, authorities can understand market expectations about future interest rates and inflation. This helps in deciding policies related to interest rates, liquidity, and credit control. The Reserve Bank of India uses such information to maintain economic stability. Changes in policy rates influence the term structure, which in turn affects borrowing and investment. This interaction helps in controlling inflation and promoting growth in the economy.
4. Pricing of Financial Instruments
The term structure is essential for pricing bonds and other financial instruments. It helps in determining the present value of future cash flows based on different interest rates for different maturities. Financial institutions use yield curves to price government securities, corporate bonds, and derivatives. Accurate pricing ensures fair valuation in the market. It also helps in identifying underpriced or overpriced securities. By providing a benchmark for interest rates, the term structure supports efficient functioning of financial markets.
5. Risk Management
The term structure helps in managing interest rate risk. Financial institutions and investors use it to assess the impact of changing interest rates on their investments. By understanding how rates vary with maturity, they can plan strategies to reduce risk. It helps in matching assets and liabilities with similar durations. This reduces exposure to losses due to interest rate changes. Banks and financial institutions rely on term structure analysis for better risk management. It ensures stability and protects investments in a changing market environment.
6. Portfolio Management
Portfolio managers use the term structure to design and manage investment portfolios. It helps in selecting securities with different maturities to balance risk and return. By analyzing yield curves, managers can adjust their portfolios based on market conditions. For example, they may invest more in long term bonds when interest rates are expected to fall. The term structure also helps in diversification and efficient allocation of funds. This improves overall portfolio performance. It is an important tool for achieving investment objectives and maintaining financial stability.
7. Determining Borrowing and Lending Decisions
The term structure guides borrowers and lenders in making financial decisions. It helps borrowers decide the best time and duration for taking loans based on interest rates. Lenders use it to set interest rates for different loan periods. A higher long term rate may encourage short term borrowing, while lower long term rates may promote long term loans. Financial institutions analyze the yield curve to design loan products. This ensures better decision making and efficient allocation of credit in the economy.