 by
by Resource loading is the process of assigning quantities of resources to scheduled activities over time. It produces a resource load chart—a graphical or tabular view showing how much of each resource (work hours, material units, or cost) is required per day, week, or month. Resource loading answers: When will each resource be needed? At what intensity? Unlike resource allocation which assigns specific resources to tasks, resource loading focuses on the total demand per time period. In Indian construction and IT projects, resource loading reveals peak demand periods (overloads) and idle periods (underloads). The resource load chart is compared against available capacity to identify overallocation. Resource loading is the first step before resource leveling or smoothing. Without resource loading, project managers lack visibility into future resource demand patterns, leading to reactive crisis management rather than proactive planning.
Importance of Resource Loading in Project Management:
1. Identifies Peak Demand Periods
Resource loading visually shows when demand for specific resources is highest. A resource load chart reveals weeks where multiple activities require the same resource simultaneously. In Indian construction projects, peak demand for cement mixers may occur during foundation week. Identifying peaks allows project managers to plan ahead—arrange additional resources, negotiate overtime, or resequence activities. Without loading analysis, peak demand surprises cause bottlenecks, delays, and emergency procurement at premium prices. Peak identification also helps in resource capacity planning across multiple projects. The project manager can smooth peaks by shifting non-critical tasks to low-demand periods. Peak demand visibility transforms reactive crisis management into proactive capacity planning.
2. Reveals Resource Underutilization
Resource loading exposes periods where resources are idle or underutilized. A resource load chart showing low demand for skilled labor indicates inefficient allocation. In Indian IT projects, underutilized developers during certain weeks represent wasted cost—salaries paid without value generation. Underutilization may also indicate schedule gaps or insufficient task assignment. Project managers can fill underutilized periods by advancing future tasks, adding scope, or reallocating resources to other projects. Idle equipment (cranes, testing labs) incurs holding costs without revenue. Resource loading quantifies underutilization, enabling data-driven decisions to improve efficiency. Without loading visibility, underutilization remains invisible, and organizational productivity suffers. Continuous underutilization may indicate overstaffing or poor project pipeline management.
3. Prevents Resource Overload (Burnout)
Resource loading highlights overallocation assigning more work than available hours. A developer allocated 60 hours of work in a 40-hour week appears as a spike on the load chart. Overallocation leads to overtime, fatigue, quality defects, and eventual burnout. In Indian IT and BPO sectors, chronic overallocation causes high attrition. Resource loading enables early detection before overload becomes crisis. The project manager can level resources by delaying non-critical tasks or adding staff. Unlike subjective feeling (“team seems busy”), loading provides objective quantification. Preventing overload also improves safety in construction and manufacturing—fatigued workers cause accidents. Organizations that monitor resource loading consistently report lower turnover and higher quality. Overload prevention is both ethical and economical.
4. Enables Realistic Schedule Development
Schedules created without resource loading assume unlimited resources—a theoretical “critical path” that may be impossible to execute. Resource loading adds reality by checking whether required resources are available when needed. In Indian infrastructure projects, a schedule showing 100 laborers in week 5 may be impossible if only 60 are available. Loading analysis reveals such gaps, forcing schedule adjustment before execution begins. The project manager resequences activities, extends duration, or adds resources. The result is a resource-feasible schedule, not just a time-feasible schedule. Without loading, the project commits to an unrealistic schedule, leading to missed deadlines, cost overruns, and stakeholder conflict. Resource loading bridges the gap between schedule theory and execution reality.
5. Supports Resource Leveling and Smoothing
Resource loading is the prerequisite for resource leveling (resolving overloads by delaying tasks, possibly extending duration) and resource smoothing (adjusting within float without extending duration). Both techniques require a load chart showing current demand vs. available capacity. In Indian manufacturing projects, loading analysis identifies which activities have float and can be shifted. Without loading, leveling is guesswork—managers delay random tasks hoping to resolve conflicts. Loading quantifies the overload magnitude (e.g., 120 hours demanded vs. 80 hours available) and shows which tasks contribute. The project manager then applies leveling algorithms systematically. Loading also enables what-if analysis—simulating different allocation scenarios to minimize duration extension. Effective leveling depends entirely on accurate resource loading.
6. Improves Cost Forecasting
Resource loading translates resource demand into cost projections. When loading shows high demand for high-cost resources (senior engineers, specialized equipment), cost spikes become visible. In Indian IT projects, loading reveals weeks with high consultant billing, enabling cash flow planning. Loading also shows underutilization periods where costs are incurred without output—identifying waste. Cost-loaded schedules integrate resource loading with cost baselines, producing time-phased budgets. The project manager can forecast when funds must be available and when cost overruns are likely. Loading also supports earned value management—comparing planned resource consumption against actual. Without loading, cost forecasts are aggregated averages that hide timing risks. Loading turns resource plans into financial plans, essential for sponsor reporting and treasury management.
7. Facilitates Resource Procurement Planning
Resource loading shows when materials and equipment must be procured. A load chart for concrete reveals peak demand in week 3, requiring orders in week 1 (considering lead time). In Indian construction, loading prevents last-minute procurement—which causes price premiums, delayed deliveries, or substitute materials. For rental equipment (cranes, generators), loading shows usage periods, enabling optimized rental contracts (avoid paying for idle days). For external contractors, loading shows when they must be on site, enabling advance scheduling. Without loading, procurement is reactive: materials ordered after demand appears, causing delays. Loading transforms procurement from reactive to proactive. It also supports vendor negotiations—vendors receive advance notice of demand patterns. Procurement planning based on loading reduces inventory holding costs while preventing stockouts.
8. Enhances Multi-Project Resource Visibility
In organizations running multiple projects simultaneously, resource loading across the portfolio reveals enterprise-wide demand patterns. A central load chart shows when the same resource (e.g., senior database administrator) is requested by Project A, B, and C simultaneously. In Indian IT services, portfolio loading prevents overallocation across projects—each project manager may see only their own demand. Central loading enables the PMO to prioritize, shift project timelines, or approve additional hiring. Without portfolio loading, resource conflicts are discovered only when the resource fails to appear, causing last-minute delays. Loading also reveals systemic shortages—if a skill is consistently overloaded across projects, the organization needs permanent hiring or training. Portfolio loading transforms resource management from project-level to enterprise-level optimization.
9. Supports What-If Scenario Analysis
Resource loading enables simulation of different allocation scenarios. What if we crash the schedule by adding weekend shifts? Load chart shows new demand pattern. What if we delay Project B by two weeks? Load chart shows reduced peak demand. In Indian construction and IT projects, what-if analysis supports change control decisions—sponsors see cost and schedule impacts before approving changes. Loading also supports risk analysis: “If the senior engineer is absent, load shifts to juniors—is that feasible?” Without loading, scenario analysis is qualitative guesswork. Loading provides quantitative basis for trade-off decisions. The project manager can compare multiple loading charts side-by-side, selecting the scenario that best balances time, cost, and resource constraints. Loading turns resource planning into an analytical, iterative process rather than one-time allocation.
10. Provides Objective Basis for Resource Requests
When project managers request additional resources from sponsors or functional managers, resource loading provides objective evidence. Instead of saying “team is overloaded,” the project manager shows a load chart with 150% utilization. In Indian government and corporate environments, budget approvals require justification. Loading charts are visual, quantitative, and difficult to dispute. The load chart also shows which specific weeks require additional resources—enabling temporary hiring rather than permanent additions. Without loading, resource requests appear as subjective complaints or political lobbying. Loading transforms requests into data-driven business cases: “Adding one junior developer for weeks 5-8 resolves 30-hour overload at ₹50,000 cost, avoiding ₹2 lakh penalty.” Sponsors respect data. Loading provides that data
Resource Load Chart:
A resource load chart (or resource histogram) is a graphical representation showing resource demand over time. The x-axis represents time (days, weeks, months); the y-axis represents resource quantity (hours, units, or cost). Each resource has its own chart or a combined view. The chart includes a capacity line showing available resource limits. Bars above the line indicate overallocation; bars below indicate underutilization. In Indian construction and IT projects, load charts are generated by scheduling software (MS Project, Primavera). Load charts support leveling decisions, procurement planning, and stakeholder communication.
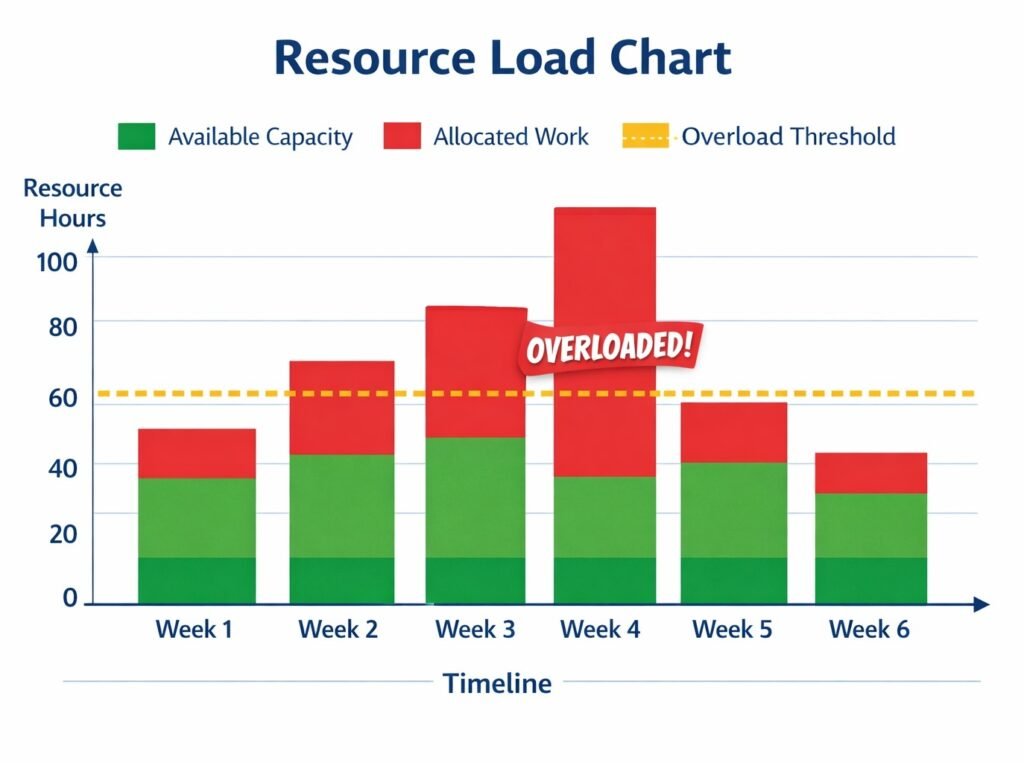
📊 How to Interpret the Chart
- Green Section (Available Capacity): The baseline hours a resource can work.
- Red Section (Allocated Work): Hours assigned to tasks.
- Yellow Dashed Line (Overload Threshold): The point beyond which resources are considered overloaded.
-
Example (from the chart above):
- Week 1–3: Resources are close to the threshold, manageable but risky.
- Week 4: Clear overload (work exceeds capacity significantly).
- Week 5: Slight overload, needs adjustment.
-
Week 6: Balanced workload, under threshold.