 by
by Project network construction is the process of creating a graphical representation of project activities and their logical dependencies. The network diagram (also called a precedence diagram or arrow diagram) shows the sequence in which activities must be performed. Each activity is represented as a node (Activity-on-Node, AON) or an arrow (Activity-on-Arrow, AOA). Arrows or links indicate dependencies—Finish-to-Start, Start-to-Start, Finish-to-Finish, or Start-to-Finish. Network construction is the foundation for Critical Path Method (CPM) and Program Evaluation Review Technique (PERT). It enables calculation of early/late start dates, finish dates, and float. In Indian construction, IT, and infrastructure projects, network diagrams reveal the logical flow of work, identify parallel activities, and highlight the critical path. Without a network, schedules are simple bar charts lacking dependency logic. Network construction transforms activity lists into structured time models.
Components of a Project Schedule Network Diagram:
1. Activity (Node)
An activity (or node) represents a distinct, scheduled element of work within the project. Each activity has a defined duration, resource requirements, and specific deliverables. In Activity-on-Node (AON) diagrams, activities are represented as rectangles or boxes. Each node contains an activity identifier (e.g., A, B, C or task name), duration estimate, and calculated values such as Early Start (ES), Early Finish (EF), Late Start (LS), Late Finish (LF), and Float (slack). Activities are derived from the Work Breakdown Structure (WBS) work packages. In Indian construction projects, an activity might be “Pour concrete for foundation” with duration of 3 days. Activities consume time and resources. They are the fundamental building blocks of the network diagram. Activities cannot be zero-duration—those are milestones. Proper activity definition ensures accurate network logic. Each activity must have clear start and finish criteria.
2. Dependency (Arrow or Link)
A dependency (also called a logical relationship or link) represents the relationship between two activities. It determines the order in which activities must be performed. In network diagrams, dependencies are shown as arrows connecting nodes (AON) or as arrows representing activities (AOA). Four dependency types exist: Finish-to-Start (FS) – Task B cannot start until Task A finishes (most common); Start-to-Start (SS) – Task B cannot start until Task A starts; Finish-to-Finish (FF) – Task B cannot finish until Task A finishes; Start-to-Finish (SF) – Task B cannot finish until Task A starts (rare). Dependencies may be mandatory (hard logic, inherent to work) or discretionary (soft logic, preferred but not required). In Indian infrastructure projects, incorrect dependency identification causes schedule collapse. Dependencies also include leads (acceleration) and lags (delays).
3. Milestone
A milestone is a significant event or achievement in the project schedule that has zero duration. It does not consume time or resources. Milestones mark completion of major phases, key deliverables, approval points, regulatory submissions, or critical decision points. In network diagrams, milestones are represented as nodes with zero duration, often depicted as diamonds or triangles. Examples include “Project Charter Approved,” “Foundation Complete,” “Code Freeze,” “Regulatory Clearance Received,” or “Final Acceptance Signed.” Milestones enable high-level progress tracking without detailed task monitoring. In Indian government projects, milestone achievement triggers payment releases and phase-gate approvals. Milestones are used in status reports to communicate progress to executives and sponsors. Missing a milestone triggers corrective action before the project is in crisis. Milestones are also called events or key points.
4. Path
A path is a continuous sequence of connected activities from the start node to the end node of the network diagram. A project network typically contains multiple paths. Each path has a total duration equal to the sum of durations of all activities on that path. The path with the longest total duration is called the critical path. Other paths have shorter durations and contain float (slack). In Indian construction projects, there may be dozens of paths—for example, foundation path, structural frame path, electrical path, finishing path. Path analysis identifies which sequences are time-critical. Paths are not explicitly drawn as separate components but are logical constructs derived from network traversal. The project manager monitors activities on the critical path most closely. Paths may converge (multiple paths joining at a node) or diverge (one path splitting into multiple). Path float is calculated as critical path duration minus path duration.
5. Float (Slack)
Float (or slack) is the amount of time an activity can be delayed without delaying the project completion date (total float) or without delaying the successor activity (free float). Total float = Late Start – Early Start (or Late Finish – Early Finish). Activities on the critical path have zero float. Positive float indicates schedule flexibility—non-critical activities can be delayed or have resources temporarily diverted. Negative float indicates the schedule is impossible and requires compression. In Indian IT projects, float is used for resource leveling—moving non-critical tasks within their float to resolve overallocation. Float is calculated during forward and backward passes through the network diagram. Float is dynamic and recalculated as the project progresses and critical path changes. Float belongs to the path, not just individual activities. Consuming float on one activity reduces float for others on the same path.
6. Dummy Activity
A dummy activity is an artificial activity with zero duration and zero resource consumption used in Activity-on-Arrow (AOA) network diagrams to represent logical dependencies correctly. Dummy activities are drawn as dashed arrows. They do not represent real work. Their sole purpose is to maintain proper precedence relationships when multiple activities share start and end nodes. In AON (Activity-on-Node) diagrams, dummy activities are not needed because nodes represent activities and arrows represent dependencies directly. In Indian project management education, dummy activities are taught for historical completeness, but modern scheduling software uses AON exclusively. Dummy activities can create confusion if overused. They add complexity without adding value. For practical scheduling in Indian construction and IT projects, AON diagrams are standard, eliminating the need for dummy activities. Understanding dummy activities is necessary only for legacy systems or academic examinations.
7. Loop (Cycle)
A loop is an illegal network configuration where activities form a closed cycle—activity A depends on B, B depends on C, and C depends on A. Loops create infinite logical contradictions because no activity can start. Loops are not permitted in project network diagrams. They indicate errors in dependency definition. Common causes include incorrect use of Start-to-Start or Finish-to-Finish relationships without proper constraints, or circular logic in discretionary dependencies. In Indian construction projects, a loop might occur if “Excavation depends on foundation design” and “Foundation design depends on soil test” and “Soil test depends on excavation access.” Software tools (MS Project, Primavera) detect loops and prevent calculation. The project manager must break loops by removing or correcting one dependency. Loops are sometimes called cycles or circular dependencies. They render the network unsolvable. Prevention requires careful dependency logic review before forward pass calculation.
8. Laddering
Laddering is a network construction technique where a long, repetitive activity is broken into smaller segments that overlap with successor activities. Instead of representing “Pour concrete for entire slab” as one 10-day activity, laddering splits it into “Pour segment 1” (2 days), then “Pour segment 2” (2 days), etc., allowing finishing work to begin on segment 1 while pouring continues on segment 2. Laddering reduces project duration without adding resources (a form of fast-tracking). In Indian construction projects, laddering is used for high-rise buildings—formwork, rebar, and concrete pour on different floors overlap. Laddering is not a separate component but a network structuring technique. It requires careful dependency definition to avoid errors. Advantages include shorter schedules. Disadvantages include increased complexity and coordination effort. Laddering is also called fragmented network or overlapping segmentation.
9. Hammock Activity
A hammock activity (also called a summary activity) is an aggregate activity that spans from the earliest start to the latest finish of a set of related activities. Its duration is calculated automatically as the time difference between its start and end milestones, not estimated directly. Hammock activities are used for reporting purposes—they show overall duration of a phase, a subcontractor’s work, or overhead activities (e.g., site supervision, quality control). In Indian construction projects, a hammock activity might be “Electrical Work” spanning from first electrical rough-in to final inspection. Hammock activities have zero duration estimates; their duration is derived from the network logic. They do not consume resources directly but may be used for cost aggregation. Hammock activities are not part of critical path calculation because they are summaries. They are useful for executive dashboards but not for detailed scheduling. Hammock activities are also called umbrella activities or spanning activities.
10. Start and End Nodes
The start node (or source node) is a unique point in the network diagram that has no predecessor activities. All initial activities originate from the start node. The end node (or sink node) has no successor activities; all terminal activities lead to it. In Activity-on-Node diagrams, start and end nodes are often dummy nodes (zero duration, added for convenience) or actual first/last activities. In Indian project scheduling practice, a single start milestone (e.g., “Project Start”) and a single end milestone (e.g., “Project Complete”) are added to simplify calculations. The start node enables forward pass calculation—all earliest start dates are computed from it. The end node enables backward pass calculation—all latest finish dates are computed backward to it. Without unique start and end nodes, float calculations become ambiguous. In projects with multiple independent starting activities, all connect to the same start node. Similarly, multiple ending activities connect to the same end node.
Types of Project Network Diagrams:
1. Activity-on-Node (AON) Diagram
AON is the most widely used project network diagram format. Activities are represented as nodes (rectangles or boxes). Arrows between nodes represent dependencies (logical relationships). Each node contains activity identifier, duration, early start, early finish, late start, late finish, and float. AON supports all four dependency types: Finish-to-Start, Start-to-Start, Finish-to-Finish, and Start-to-Finish. Advantages include ease of drawing, compatibility with computer software (MS Project, Primavera), and ability to show leads and lags. Disadvantages include larger diagram size for complex projects. In Indian construction and IT projects, AON is standard. Forward pass calculates early start/finish; backward pass calculates late start/finish. Critical path activities have zero float. AON does not require dummy activities. Modern scheduling tools use AON exclusively. Understanding AON is essential for PMP and other certifications.

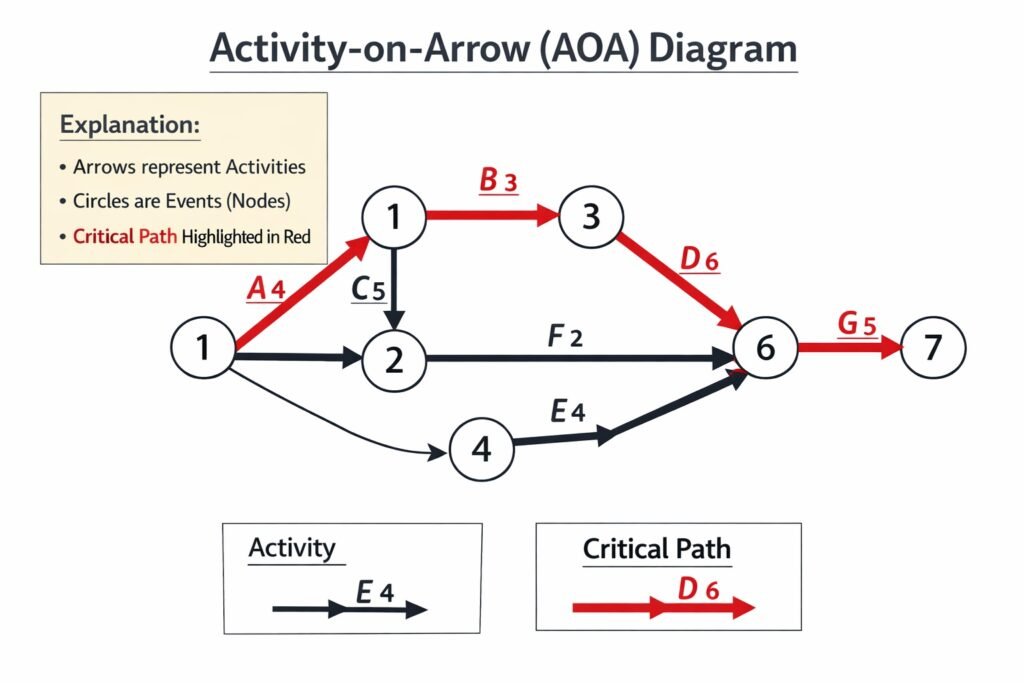
2. Activity-on-Arrow (AOA) Diagram
AOA is an older network diagram format where arrows represent activities and nodes represent events (start or completion points). The tail of the arrow is the start event; the head is the finish event. Multiple activities can share the same start and end nodes. AOA supports only Finish-to-Start dependencies. Dummy activities (zero duration, dashed arrows) are required when multiple activities share the same start and end nodes to maintain correct logic. Advantages include compact representation and historical significance. Disadvantages include difficulty drawing, limited dependency types, and requirement of dummy activities. In Indian project management education, AOA is taught for theoretical understanding, but industry practice uses AON. AOA is rarely used in modern software. Calculation methods (forward/backward pass) are similar to AON but applied to events rather than activities.
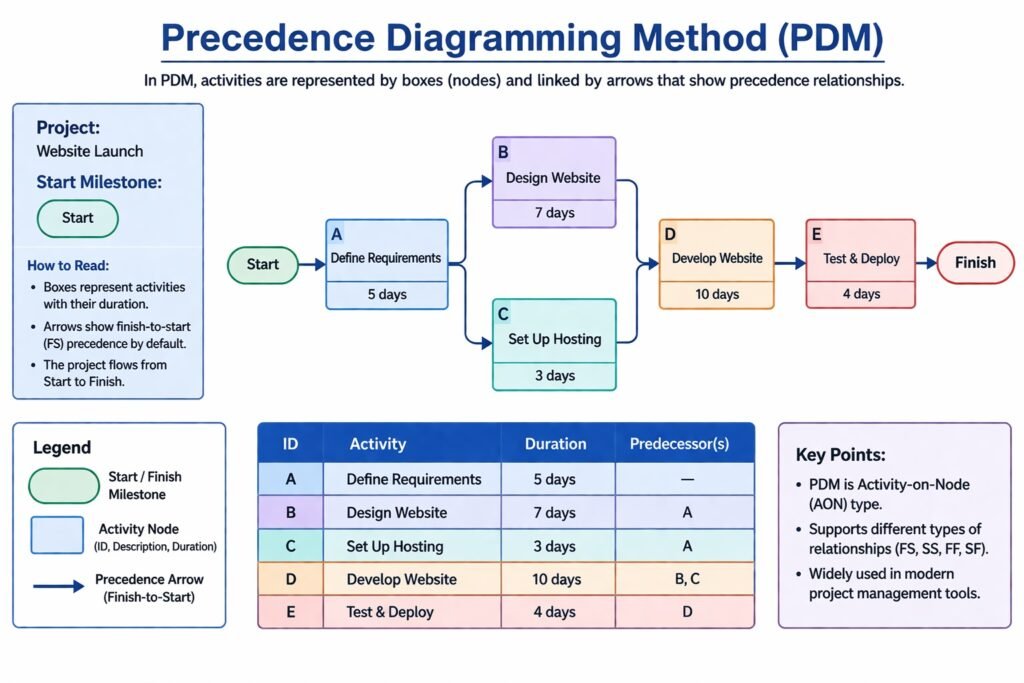
3. Precedence Diagramming Method (PDM)
PDM is a specific technique for constructing AON diagrams. It uses nodes for activities and arrows for dependencies. PDM supports four dependency types: Finish-to-Start (FS), Start-to-Start (SS), Finish-to-Finish (FF), and Start-to-Finish (SF). It also supports leads (negative lags) and lags (positive delays). For example, FS + 2 days means successor starts 2 days after predecessor finishes. SS – 1 day means successor starts 1 day before predecessor starts (lead). PDM is the standard method used in MS Project, Primavera, and most scheduling software. Advantages include flexibility in representing complex logic and widespread software support. Disadvantages include potential for logical errors (e.g., creating loops) if dependencies are incorrectly specified. In Indian infrastructure projects, PDM is used for all network scheduling. PDM enables critical path calculation, float determination, and what-if analysis. PDM has replaced Arrow Diagramming Method (ADM) in practice.
4. Arrow Diagramming Method (ADM)
ADM is the traditional technique for constructing AOA diagrams. Arrows represent activities; nodes (circles) represent events. ADM supports only Finish-to-Start dependencies. Dummy activities (dashed arrows) are required to show logical relationships correctly when multiple activities share start and end nodes. ADM does not support leads, lags, or other dependency types (SS, FF, SF). Advantages include historical importance and compact representation. Disadvantages include limited logic expression, difficulty in drawing complex networks, and requirement of dummy activities that add confusion. In Indian project management education, ADM is taught for historical understanding and examination purposes. Industry practice has almost completely replaced ADM with PDM (AON). ADM is not supported in modern scheduling software except for legacy conversions. Students should understand ADM for certification exams but prioritize PDM for practical application. ADM is also called Activity-on-Arrow (AOA).
![]()
5. Conditional Diagramming Method
Conditional diagramming is a network technique that allows non-sequential paths based on conditions or decisions. Unlike PDM/ADM where all activities are executed, conditional diagrams include branches that depend on outcomes (e.g., “If test passes, proceed to deployment; else return to design”). This technique uses loops (feedback paths) which are prohibited in traditional CPM networks. Advantages include realistic modeling of iterative processes (software debugging, R&D, design-review cycles). Disadvantages include complexity, difficulty in calculating critical path, and lack of support in standard scheduling software. In Indian software development and R&D projects, conditional logic is handled through Agile methods or separate risk plans rather than network diagrams. Conditional diagramming is also called GERT (Graphical Evaluation and Review Technique). Unlike PERT which assumes all activities are executed, GERT allows probabilistic branching. GERT requires specialized software and is rarely used in routine project management.

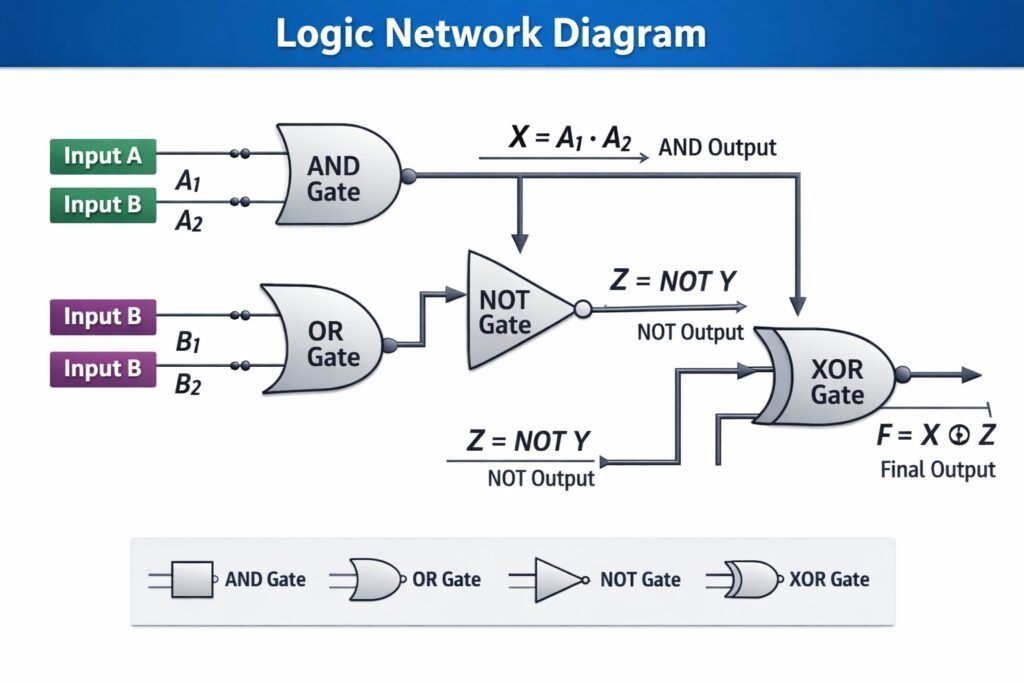
6. Logic Diagram (Logical Network)
A logic diagram is a simplified network diagram showing only logical dependencies between activities without duration or timing information. It focuses on “what precedes what” rather than “when.” Logic diagrams are created during early planning to validate dependency logic before adding durations. Components include activities (nodes) and dependencies (arrows). No early/late dates, float, or critical path are calculated. Advantages include simplicity, focus on logic correctness, and ease of stakeholder review. Disadvantages provide no schedule information. In Indian construction projects, logic diagrams are drawn on whiteboards during planning workshops to ensure team agreement on activity sequence. Once logic is validated, durations are added and the network is converted to a CPM schedule. Logic diagrams are also called precedence diagrams (without timing). They are useful for identifying missing dependencies or incorrect sequencing. Software tools can import logic diagrams and convert to scheduled networks.
7. Time-Scaled Network Diagram
A time-scaled network diagram combines network logic with a time axis. Activities are positioned horizontally according to their early start dates. The length of each activity node is proportional to its duration (unlike standard AON where nodes are uniform size). Dependencies are shown as arrows connecting the scaled nodes. This format visually shows which activities run in parallel and which are sequential. Advantages include intuitive understanding of time relationships and easy identification of concurrent work. Disadvantages include difficulty modifying when dates change (nodes must be repositioned) and clutter for large networks. In Indian construction and event management projects, time-scaled diagrams are used for site coordination boards. They are often drawn manually or using specialized software. Time-scaled diagrams are also called bar chart networks or logic bar charts. They are less common than separate Gantt charts and network diagrams.

8. Fragment Network (Subnetwork)
A fragment network (or subnetwork) is a smaller network diagram representing a portion of the overall project. Fragments are used for repetitive work modules, detailed design of complex phases, or sections managed by subcontractors. Each fragment has its own activities, dependencies, start node, and end node. Fragments are linked to the main network through interface points (dependencies between fragment activities and main network activities). Advantages include manageability, parallel development by different planners, and reusability across similar project sections. Disadvantages include risk of missing interface dependencies. In Indian high-rise construction, a fragment network for “one floor” is created and repeated for multiple floors. In IT projects, fragments are used for each software module. Fragment networks are integrated into the master network using dummy activities or interface dependencies. This technique is also called network decomposition or modular network construction.

Advantages of Project Network Diagrams:
1. Clear Visualization of Project Activities
Project Network Diagrams provide a clear visual representation of all project activities and their sequence. They show how tasks are connected from start to finish. This helps team members easily understand the flow of work. In Indian projects, where multiple activities happen at the same time, visual clarity reduces confusion. It also helps in identifying the start and end points of each task. Managers can quickly see the overall structure of the project. This improves understanding and coordination among team members, leading to smoother execution and better management of project activities from beginning to completion.
2. Identification of Critical Path
One of the main advantages of Project Network Diagrams is identifying the critical path. The critical path shows the longest sequence of activities that determines the project duration. In Indian projects, delays are common, so knowing critical tasks is very important. Managers can focus more on these activities to avoid delays. It helps in prioritizing work and allocating resources efficiently. If any task on the critical path is delayed, the entire project gets delayed. Therefore, identifying the critical path helps in better time management and ensures timely completion of the project without unnecessary delays.
3. Better Planning and Scheduling
Project Network Diagrams help in effective planning and scheduling of project activities. They show the sequence and timing of each task, making it easier to prepare a proper schedule. In India, where projects often face delays, proper scheduling is very important. These diagrams help managers plan tasks in advance and set realistic timelines. They also assist in identifying dependencies between activities. This reduces confusion and improves efficiency. Proper planning ensures smooth execution and better use of resources. Therefore, network diagrams play an important role in organizing project activities and ensuring timely completion.
4. Improved Coordination and Communication
Project Network Diagrams improve coordination and communication among team members. They provide a common understanding of project activities and their relationships. In Indian projects, where teams are large and diverse, clear communication is essential. Network diagrams help in explaining tasks and dependencies easily. This reduces misunderstandings and improves teamwork. Team members can see how their work affects others. It also helps in sharing progress and updates effectively. Better communication leads to smooth execution and faster problem-solving. Therefore, network diagrams help in improving coordination and ensuring successful project implementation.
5. Helps in Identifying Dependencies
Project Network Diagrams clearly show the dependencies between different activities. Some tasks cannot start until others are completed. In Indian projects, managing dependencies is important due to limited resources and tight schedules. These diagrams help managers understand which tasks depend on others. This ensures proper sequencing of activities. It also helps in avoiding delays caused by improper planning. By identifying dependencies, managers can plan better and ensure smooth workflow. This reduces confusion and improves efficiency. Therefore, understanding task relationships is an important advantage of using project network diagrams in project management.
6. Better Monitoring and Control
Project Network Diagrams help in monitoring and controlling project progress. Managers can compare actual progress with planned activities shown in the diagram. In India, where delays and cost overruns are common, monitoring is very important. These diagrams help in identifying delays early and taking corrective action. Managers can track which tasks are completed and which are pending. This improves decision-making and control over the project. Proper monitoring ensures that the project stays on track. Therefore, network diagrams provide a useful tool for controlling project activities and achieving project objectives efficiently.
Disadvantages of Project Network Diagrams:
1. Complexity in Large Projects
Project Network Diagrams become very complex in large projects with many activities and dependencies. In Indian infrastructure or IT projects, the number of tasks can be very high, making the diagram difficult to understand. Too many connections and paths create confusion among team members. It becomes hard to identify important activities quickly. Managing and updating such complex diagrams also requires expertise. If not handled properly, it may lead to errors in planning and execution. Therefore, complexity is a major disadvantage, as it reduces clarity and makes project management more difficult in large-scale projects.
2. Time-Consuming to Prepare
Preparing a Project Network Diagram requires detailed information about all activities and their relationships. This process takes a lot of time, especially in the initial stage. In Indian projects, where quick execution is often expected, this can be a drawback. Collecting data, identifying dependencies, and designing the diagram requires effort and coordination. For small projects, this process may not be necessary and can waste time. Delays in preparing the diagram may also postpone project start. Therefore, the time-consuming nature of creating network diagrams is a limitation, especially when fast decision-making and quick action are required.
3. Requires Skilled Knowledge
Project Network Diagrams require proper knowledge and skills to prepare and interpret. Techniques like PERT and CPM are not easy for everyone to understand. In India, not all organizations have trained professionals in project management. Lack of knowledge can lead to incorrect diagrams and poor decision-making. Team members may find it difficult to follow complex diagrams. Training employees also requires time and cost. Without proper expertise, the benefits of network diagrams cannot be fully utilized. Therefore, the need for skilled knowledge is a disadvantage, as it limits the effective use of network diagrams in some organizations.
4. Difficulty in Updating Changes
Project Network Diagrams need to be updated regularly when there are changes in activities or timelines. In practice, this can be difficult. In Indian projects, frequent changes due to external factors are common. Updating the diagram every time requires effort and time. Even a small change in one activity may affect many other tasks. This makes updating complicated and confusing. If the diagram is not updated properly, it becomes outdated and less useful. Therefore, difficulty in updating is a disadvantage, as it affects the accuracy and usefulness of the network diagram in managing project progress effectively.
5. Overemphasis on Time Aspect
Project Network Diagrams mainly focus on time and sequence of activities. They do not give much importance to cost, quality, or resource availability. In Indian projects, factors like budget constraints and resource shortages are very important. Ignoring these aspects may lead to unrealistic planning. Managers may focus only on completing tasks on time without considering other important factors. This can affect the overall success of the project. Therefore, overemphasis on time is a limitation, as it does not provide a complete view of project management and may lead to poor decision-making.
6. Not Suitable for Small Projects
Project Network Diagrams are more useful for large and complex projects. For small projects, they may not be necessary. In India, many small businesses and projects operate with simple methods. Preparing a network diagram for such projects may increase workload without much benefit. It may also waste time and resources. Simple projects can be managed easily without detailed diagrams. Therefore, using network diagrams in small projects may not be efficient. This makes it a disadvantage, as it is not suitable for all types of projects and may reduce efficiency in simple and small-scale project management situations.
One thought on “Project Network Construction, Components, Types, Advantages, Disadvantages”