 by
by Industrial cycles refer to the periodic, recurring patterns of expansion and contraction in business activity within specific industries or the broader economy. Unlike predictable seasonal fluctuations, industrial cycles involve multi-year phases of growth (boom), peak (slowdown), contraction (recession), and trough (recovery). Each industry experiences cycles of varying amplitude and duration depending on its sensitivity to macroeconomic conditions, technological change, and competitive dynamics.
Importance of Industrial Analysis:
1. Determines Industry Profitability Potential
Industry analysis reveals whether an industry’s structural characteristics permit sustained profitability or condemn participants to intense competition and thin margins. Managers cannot rely solely on firm-specific strategy; competing in an unattractive industry (airlines, textiles) requires exceptional execution just to earn average returns, while even mediocre firms in attractive industries (pharmaceuticals, software) may earn healthy profits. Industry analysis quantifies this baseline: industries with high entry barriers, low supplier/buyer power, few substitutes, and moderate rivalry offer superior profit pools. This assessment guides capital allocation—investing in structurally attractive industries, divesting from unattractive ones, or developing strategic innovations to restructure industry conditions.
2. Identifies Sources of Competitive Pressure
Industry analysis systematically maps where competitive pressure originates—not only from direct rivals but also from suppliers, buyers, substitutes, and potential entrants. Each pressure source demands different strategic responses: powerful suppliers require backward integration or supplier diversification; powerful buyers require differentiation or loyalty programs; substitutes require performance improvement or switching cost creation; new entrants require entry barrier construction like scale or brand investment. Without this diagnostic, organizations focus narrowly on familiar direct competitors, ignoring profit erosion from other forces. For example, a retailer may obsess about other retailers while ignoring Amazon (substitute channel) or Walmart (powerful buyer relative to small suppliers).
3. Supports Strategic Positioning Decisions
Industry analysis provides the external context necessary for choosing among generic strategies: cost leadership, differentiation, or focus. Not all strategies are feasible in all industry structures. Cost leadership requires scale economies, process technology access, and intense cost control discipline—impossible in fragmented industries lacking scale opportunities. Differentiation requires customer willingness to pay premium for uniqueness—unsustainable in commodity industries where buyers perceive no meaningful differences. Focus requires identifiable niche with distinct needs—absent in highly homogeneous markets. Industry analysis prevents the fatal “stuck in the middle” trap (neither low cost nor differentiated) by revealing which strategic positions industry structure rewards and which it punishes. Strategy without industry analysis is guesswork.
4. Forecasts Industry Evolution
Industries change systematically through life cycle stages (introduction, growth, maturity, decline) and varying cycle phases (expansion, contraction). Industry analysis examines historical structural changes, identifies current stage, and forecasts future trajectories. This foresight enables proactive adaptation rather than reactive crisis management. Expansion-phase strategies (capacity investment, aggressive hiring, inventory building) differ fundamentally from contraction-phase strategies (cost cutting, inventory reduction, preservation of cash). Organizations that continue growth-phase strategies into maturity (e.g., adding capacity when demand is flat) destroy shareholder value. Industry analysis also identifies structural inflection points—deregulation, disruptive technology, or globalization—that permanently reset competitive rules, separating transient cyclical changes from fundamental transformation.
5. Enables Competitor Anticipation
Industry structure shapes how competitors are likely to behave. In concentrated industries (few large firms), competitors notice and retaliate against strategic moves—price cuts trigger immediate matching; capacity additions provoke overcapacity. In fragmented industries (many small firms), unilateral moves go unnoticed. High exit barriers trap firms in declining industries, forcing desperate, irrational competitive behavior (selling below cost to generate cash). High switching costs lock in customers, reducing competitive battles for existing accounts. Understanding these structural drivers enables prediction: “If we cut price, how will competitors likely respond?” Anticipation prevents initiating mutually destructive price wars or announcing capacity expansions that trigger preemptive competitor investments. Industry analysis transforms competitor behavior from unpredictable surprise to structurally constrained probabilities.
6. Guides Entry and Exit Timing
Industry analysis provides the analytical framework for deciding when to enter new industries and when to exit current ones. Entry timing analysis examines: Is industry structurally attractive? Are entry barriers surmountable given our resources? Will incumbents retaliate? What is the industry life cycle stage (entering decline is foolish)? Exit timing analysis examines: Is industry decline permanent or cyclical? What are exit barriers (specialized assets, contracts, emotional attachment)? Can we harvest value (sell assets, extract cash) before terminal decline? Entry without analysis (chasing “hot” industries) leads to costly failures—dot-com bubble entrants, craft brewery boom followers. Exit without analysis leads to value destruction—holding declining assets while maintenance consumes cash. Industry analysis replaces emotional or herding decisions with calculated, evidence-based timing.
7. Benchmarks Firm Performance
Industry analysis establishes performance benchmarks against which individual firms assess their competitive position. Average industry profitability, growth rates, cost structures, and productivity levels provide reference points. An organization earning 10% margin cannot judge whether this represents success or failure without knowing industry average (15% indicates underperformance; 5% indicates exceptional performance). Benchmarking reveals whether below-average performance stems from firm-specific weaknesses (correctable through better execution) or industry structural problems (requiring exit or fundamental repositioning). Industry analysis also benchmarks across strategic groups—perhaps the organization underperforms relative to its strategic group (direct competitors) but outperforms other groups. Performance evaluation without industry context is meaningless; managers may celebrate mediocrity or despair over superior results misunderstood as failure.
8. Informs Resource Allocation
Limited capital, talent, and attention must be allocated across business units, product lines, or geographic markets. Industry analysis informs these trade-offs by revealing which industries offer structurally superior profit pools and growth trajectories. Corporate portfolio tools (BCG matrix, GE-McKinsey) explicitly integrate industry attractiveness (derived from industry analysis) with business unit strength to guide investment priorities: invest in attractive industries where the firm possesses competitive advantage; harvest or divest unattractive industries regardless of current profitability (profits will erode as structure worsens). Without industry analysis, resource allocation defaults to historical patterns or political power—funding yesterday’s winners while starving tomorrow’s opportunities. Industry analysis introduces rational, externally grounded criteria for capital budgeting and strategic resource redeployment across the corporate portfolio.
9. Supports Merger and Acquisition Strategy
Industry analysis identifies structurally attractive industries, strategic groups within industries, and potential acquisition targets that would improve portfolio positioning. Horizontal acquisitions (same industry) aim to increase concentration, reduce rivalry, achieve scale economies, or acquire strategic assets (brands, patents, distribution). Vertical acquisitions (suppliers or buyers) aim to reduce supplier/buyer power or capture profit pools across value chain stages. Industry analysis quantifies these benefits and reveals structural barriers to post-merger integration (different strategic groups, incompatible cultures). Conversely, industry analysis identifies industries to exit via divestiture—selling business units in declining or structurally unattractive industries. M&A without industry analysis produces expensive failures: acquiring market share in declining industries, paying premiums for businesses with deteriorating structural conditions, or merging with culturally incompatible strategic groups.
10. Identifies Profit Pools and Value Migration
Industry analysis reveals where economic value accumulates across industry value chains, customer segments, or product categories—profit pools. Revenue concentration often misleads; the largest revenue activities may generate the thinnest profits. For example, automobile manufacturing captures high revenues but low margins; financing, insurance, and after-sales service capture disproportionate profit despite smaller revenue. Industry analysis maps profit pool distribution and identifies value migration trends—profits moving from one activity to another over time (e.g., hardware to software, products to services, wholesale to direct-to-consumer). Organizations use profit pool maps to decide where to compete: entering high-profit-pool activities, exiting low-profit-pool activities, or repositioning along migration paths. Without profit pool analysis, organizations may dominate large revenue markets while starving in profit-rich niches or double down on activities from which profits are actively migrating away.
Phases of Industrial Cycle:
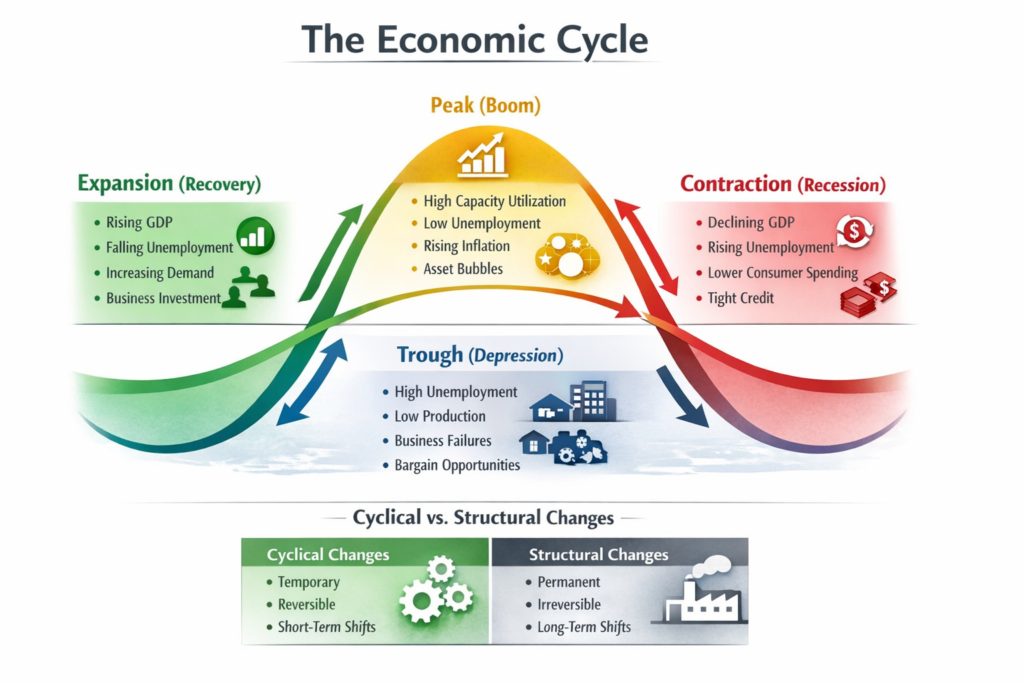
1. Expansion (Recovery)
Expansion is the phase where economic activity accelerates following a trough. Key indicators include rising GDP, increasing consumer demand, growing industrial production, declining unemployment, and improving business confidence. Organizations experience rising sales, capacity utilization increases, and inventory levels normalize. During early expansion, firms cautiously add temporary workers and delay capital investment until recovery confirms sustainability. As expansion strengthens, businesses pursue capacity expansion, inventory building, new hires, and marketing investment. Competitive dynamics intensify as dormant rivals re-enter markets. Strategic priorities include: capturing market share from slower competitors, investing in capacity ahead of peak demand, locking in suppliers before prices rise, and recruiting talent before labor markets tighten. Expansion phase typically lasts 2–10 years depending on economic shocks and policy responses. Successful navigation requires distinguishing temporary upturns from sustained structural growth.
2. Peak (Boom)
The peak represents maximum economic activity before contraction begins—the turning point where expansion ends. Characteristics include: capacity utilization at or above normal (often >85%), extremely low unemployment (sometimes below “natural rate” causing wage inflation), rising interest rates (central banks combatting inflation), asset price bubbles (stocks, real estate), over-optimistic business expectations, and inventory accumulation beyond sustainable levels. Marginal customers (those who only buy in strong economies) enter markets. Competitive behavior shifts: firms add expensive capacity, hire difficult-to-find workers (lowering hiring standards), increase marketing spending, and extend supplier payment terms. Strategic risks include: mistaking temporary peak conditions for permanent trends (investing in capacity that will become excess), over-hiring (creating later layoffs), and aggressive price increases that accelerate customer switching to substitutes. Peak-phase strategies emphasize cash preservation, receivable collection, and selective deleveraging.
3. Contraction (Recession)
Contraction is the phase where economic activity declines from peak to trough. Characteristics include: falling GDP for two consecutive quarters (technical recession definition), declining consumer demand, rising unemployment (layoffs, hiring freezes), falling industrial production, decreasing business investment, tightening credit conditions (banks reluctant to lend), and inventory liquidation (firms selling accumulated stock below cost). Competitive dynamics intensify as firms fight for shrinking revenue through price cuts, promotional spending, and aggressive collection of receivables. Weaker competitors fail (bankruptcy, exit). Strategic priorities shift dramatically: preserve cash (reduce discretionary spending, delay capital investment), protect profitable core customers (non-essential segments may be dropped), reduce inventory, renegotiate supplier terms, and selectively acquire distressed competitors or assets at depressed prices. Organizations that prepared during expansion (low debt, strong balance sheets) gain competitive advantage over leveraged competitors forced into distress sales.
4. Trough (Depression)
The trough is the lowest point of economic activity before recovery begins—the turning point from contraction to expansion. Characteristics include: maximum unemployment (some industries >15%), extensive business failures, severely depressed asset prices (stocks, real estate, equipment available fraction of previous value), extremely low capacity utilization (<65%), minimal business investment, tight credit (banks recovering from loan losses), and pessimistic expectations (managers assume conditions will worsen indefinitely). Only the strongest, best-managed, or luckiest firms survive trough conditions. Strategic opportunities amid crisis: acquire assets (factories, equipment, patents) at distressed prices, recruit talent from failed competitors, gain market share from weakened rivals unable to defend positions, and renegotiate long-term contracts (rent, supply, leases) from positions of relative strength. Trough-phase strategies require cash reserves (built during expansion/peak) and courage to act while others panic. Organizations that position during trough emerge leaner, stronger, and better market-positioned when expansion resumes.
5. Recession (Severe Contraction – sometimes separated)
Some frameworks distinguish between mild contraction (“recession”) and severe, prolonged contraction (“depression”). Recession is widespread but not catastrophic: GDP decline 2–5%, unemployment peaking 7–11%, lasting 6–18 months. Most businesses survive but with reduced profits, layoffs, and postponed investment. Strategic responses include: cost reduction (without destroying long-term capabilities), targeted marketing to price-sensitive segments, extending payables, accelerating receivables, and releasing non-core temporary staff. Depression (rare, e.g., 1930s, 2008 in some countries) involves GDP decline >10%, unemployment >15–25%, widespread bank failures, and multi-year duration requiring fundamentally different strategies: survival priority over profitability, aggressive debt reduction, asset sales, and sometimes business model reinvention. Distinguishing recession from depression early is critical; treating depression as ordinary recession (maintaining normal operations) leads to bankruptcy.
6. Cyclical vs. Structural Changes (Cross-Phase Consideration)
Not all economic changes are cyclical (temporary, reversible); some are structural (permanent, irreversible). Industrial cycle analysis must distinguish between the two to avoid strategic errors. Cyclical changes: demand fluctuations due to confidence, interest rates, or inventory adjustments—these reverse as economy recovers. Structural changes: technological disruption (e-commence replacing retail), regulatory shifts (deregulation), demographic aging (shrinking labor force), or globalization—these permanently alter industry conditions. Mistaking structural decline for cyclical contraction leads to “waiting for recovery that never comes” (e.g., US steel industry in 1980s). Mistaking cyclical contraction for structural decline leads to premature exit or underinvestment (e.g., airlines after 9/11—demand recovered). Diagnosis tools: examine industry-specific vs. economy-wide patterns, duration (structural changes persist across cycles), and capacity exit (structural requires permanent exit of production capacity, not temporary idling).
7. Recovery (Early Expansion – sometimes separated as distinct phase)
Recovery is the transition from trough to sustained expansion, distinct enough from mature expansion to warrant separate analysis. Characteristics include: initial demand increase (often from inventory restocking, replacement purchases deferred during contraction), cautious business responses (temporary hiring, overtime before new permanent hires, used equipment purchases before new), still-high unemployment (lags recovery), and high uncertainty (managers skeptical recovery will sustain). Strategic positioning: prepare for accelerating demand without over-committing to fixed costs. Actions: extend hours before adding shifts, use temporary/contract workers, lease rather than buy equipment, rebuild inventory selectively, and maintain cost controls from contraction phase. First-movers who expand capacity early gain market share but risk if recovery falters (double-dip recession). Late movers preserve flexibility but lose growth opportunities. Successful recovery strategy balances aggression (capturing market share from slower competitors) with caution (preserving cash, avoiding irreversible commitments until expansion confirms).
8. Industry-Specific Cycle Variations
Industrial cycles vary significantly across industries in amplitude (severity), duration, and timing relative to general economy. Cyclical industries (automotive, construction, travel, luxury goods) experience much larger demand fluctuations—booms are boomier, busts are buster. Defensive industries (utilities, healthcare, consumer staples, funeral services) experience minimal cycle impact; demand remains stable across phases. Counter-cyclical industries (bankruptcy law firms, pawn shops, low-end retail, debt collection) perform better during contraction than expansion. Timing differences: housing construction leads general cycles (peaks before overall economy peaks); commercial construction lags; technology capital expenditure leads expansion but collapses early in contraction. Strategic implications: organizations in cyclical industries require stronger balance sheets (debt reduction during peaks) and flexible cost structures (variable pay, contract manufacturing) than defensive-industry firms. Portfolio diversification across industries with uncorrelated cycles reduces corporate earnings volatility. Industry cycle analysis must be industry-specific, not relying solely on general economy indicators.