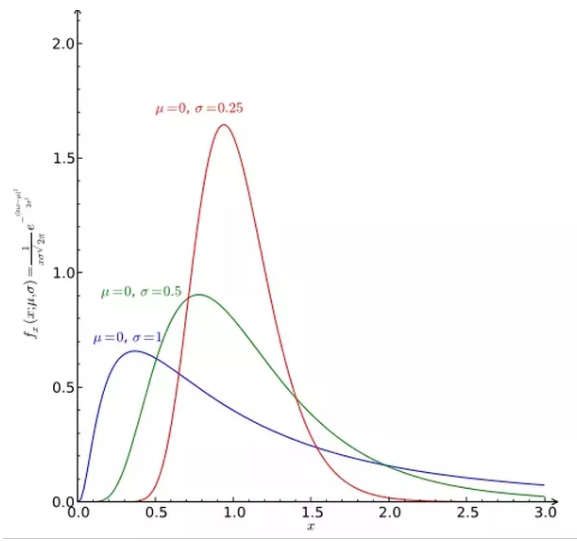
Skewness, in statistics, is the degree of distortion from the symmetrical bell curve, or normal distribution, in a set of data. Skewness can be negative, positive, zero or undefined. A normal distribution has a skew of zero, while a lognormal distribution, for example, would exhibit some degree of right-skew.
The three probability distributions depicted below depict increasing levels of right (or positive) skewness. Distributions can also be left (negative) skewed. Skewness is used along with kurtosis to better judge the likelihood of events falling in the tails of a probability distribution.

Right skewness
- Skewness, in statistics, is the degree of distortion from the symmetrical bell curve in a probability distribution.
- Distributions can exhibit right (positive) skewness or left (negative) skewness to varying degree.
- Investors note skewness when judging a return distribution because it, like kurtosis, considers the extremes of the data set rather than focusing solely on the average.
Broadly speaking, there are two types of skewness: They are
(1) Positive skewness
(2) Negative skewnes.
Positive skewness
A series is said to have positive skewness when the following characteristics are noticed:
- Mean > Median > Mode.
- The right tail of the curve is longer than its left tail, when the data are plotted through a histogram, or a frequency polygon.
- The formula of Skewness and its coefficient give positive figures.
Negative skewness
A series is said to have negative skewness when the following characteristics are noticed:
- Mode> Median > Mode.
- The left tail of the curve is longer than the right tail, when the data are plotted through a histogram, or a frequency polygon.
- The formula of skewness and its coefficient give negative figures.
Thus, a statistical distribution may be three types viz.
- Symmetric
- Positively skewed
- Negatively skewed
Skewness Co-efficient
- Pearson’s Coefficient of Skewness #1 uses the mode. The formula is:

Where
 = the mean, Mo = the mode and s = the standard deviation for the sample.
 - Pearson’s Coefficient of Skewness #2 uses the median. The formula is:

Where
 = the mean, Mo = the mode and s = the standard deviation for the sample.
It is generally used when you don’t know the mode.