 by
by Standard Deviation (SD) is the most widely used measure of dispersion in statistics. It quantifies the amount of variation or spread in a set of data values. A low standard deviation indicates that the data points tend to be close to the mean, whereas a high standard deviation shows that the values are spread out over a wider range.
It is considered more accurate than other measures like range or mean deviation because it takes all values into account and gives greater weight to extreme deviations.
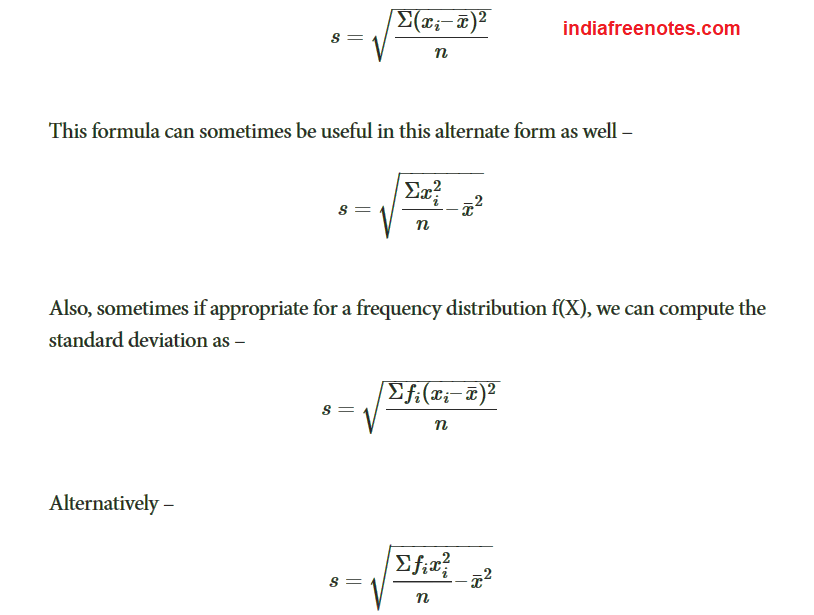
Therefore, we define the formula for the standard deviation of the distribution of a variable X with n data points as:
Where:
-
= Standard Deviation
-
= Each individual observation
-
= Mean of the observations
-
N = Number of observations
Characteristics of Standard Deviation:
- Based on All Observations
Standard Deviation considers every value in the dataset, making it a comprehensive and accurate measure of dispersion. Each individual deviation from the mean is squared and included in the calculation. This ensures that no data point is ignored, unlike measures like the range, which only uses two values. As a result, SD gives a complete picture of the spread and is ideal for statistical analysis.
- Expressed in Original Units
Unlike variance, which is expressed in squared units, standard deviation is in the same unit as the original data. For example, if the data is in kilograms, the standard deviation is also in kilograms. This makes SD easy to interpret and more meaningful in practical situations. It allows analysts and researchers to make direct comparisons and understand the spread of values in real-world terms.
- Sensitive to Extreme Values
Standard Deviation gives greater weight to larger deviations due to the squaring of differences. As a result, extreme values or outliers have a significant impact on the final result. This characteristic is both a strength and a limitation—it reflects genuine variation but may exaggerate dispersion in datasets with outliers. It is best used when data is normally distributed or has minimal extremes.
- Useful for Comparing Consistency
Standard Deviation is a powerful tool for comparing the consistency of different datasets. A lower standard deviation means the values are more closely clustered around the mean, indicating greater consistency. A higher value indicates more variability. For example, in comparing employee performance or machine output, the group with the lower standard deviation is more consistent, even if both have the same average.
- Mathematical Stability and Accuracy
Standard Deviation is mathematically stable and accurate. It is used as the basis for many statistical techniques, including hypothesis testing, regression analysis, and control charts. The mathematical rigor behind its formula ensures that it responds predictably to changes in the data. This consistency makes SD a preferred measure in research, finance, economics, and quality control studies.
- Applicable to Both Individual and Grouped Data
Standard Deviation can be calculated for both individual (ungrouped) and grouped frequency data. This makes it a versatile tool for analyzing different types of datasets, whether small surveys or large-scale census reports. The formula can be adapted accordingly, making it a standard component in statistical software, research studies, and academic evaluations.
- Foundation for Coefficient of Variation
The Coefficient of Variation (CV), which measures relative dispersion, is based on standard deviation. By expressing SD as a percentage of the mean, CV allows for the comparison of variability between datasets with different units or scales. This enhances the usefulness of standard deviation by enabling analysts to assess relative consistency across different groups or categories.
- Integral to Normal Distribution and Probability
Standard Deviation plays a key role in the normal distribution, where data is symmetrically spread around the mean. In a normal curve, approximately 68% of values lie within one SD, 95% within two SDs, and 99.7% within three. This makes SD essential in probability theory, confidence intervals, and statistical inference, guiding predictions and decision-making in many fields.
Scope of Standard Deviation:
- Statistical Data Analysis
Standard deviation plays a central role in data analysis across disciplines. It quantifies variability and helps identify how much individual data points deviate from the average. This allows researchers to understand data distribution, detect outliers, and assess reliability. Whether analyzing survey results, test scores, or experimental outcomes, standard deviation helps make conclusions more precise and decisions more data-driven.
- Economics and Financial Planning
In economics and finance, standard deviation is used to measure volatility in prices, returns, and economic indicators like GDP or inflation. It helps economists and analysts determine the risk and predictability of variables. Investors use it to assess the uncertainty in asset returns and to build diversified portfolios. Its application enables effective risk management, pricing strategies, and informed investment decisions in dynamic financial environments.
- Education and Assessment Systems
Standard deviation is widely applied in education to assess academic performance and grading patterns. It helps educators evaluate whether students’ scores are consistent or widely dispersed. This is useful in determining grading curves, analyzing school performance across years, and designing assessments. A lower standard deviation shows uniform performance, while a higher one indicates disparities, helping in revising teaching strategies or addressing educational gaps.
- Manufacturing and Process Control
In production and manufacturing, standard deviation is key to maintaining quality control. It monitors consistency in product specifications, identifying variations that may indicate defects. Used in Six Sigma and control charts, standard deviation ensures processes stay within acceptable limits. It helps reduce waste, improve productivity, and maintain customer satisfaction by ensuring uniform quality in mass production and assembly lines.
- Scientific and Medical Research
Standard deviation is essential in scientific studies for measuring experimental precision and variability in results. In clinical trials, medical experiments, and lab testing, it quantifies the reliability of findings. Researchers use it to report margins of error, establish confidence levels, and validate hypotheses. Its use supports peer-reviewed science, ensuring data consistency and the reproducibility of experimental results across disciplines.
- Environmental and Climate Studies
In environmental science, standard deviation measures fluctuations in temperature, rainfall, pollution, and other natural phenomena. It helps meteorologists and climate scientists assess the stability of weather patterns and identify changes over time. By analyzing long-term deviations from the average, researchers can study climate variability, detect trends like global warming, and create more accurate models for weather prediction and disaster preparedness.
- Psychology and Social Sciences
Standard deviation is widely used in behavioral sciences to analyze variability in human responses, test scores, or social patterns. It assists in evaluating consistency among individuals or groups in surveys, personality tests, or behavioral experiments. Psychologists use it to determine normality, detect anomalies, and validate test reliability. It supports meaningful interpretation in research where subjective behavior needs objective measurement.
- Business and Market Research
In business analytics and market research, standard deviation assesses customer preferences, satisfaction levels, and market trends. It helps companies understand how consumer behavior varies and whether product or service feedback is consistent. This aids in decision-making related to marketing strategies, product development, and service improvements. A consistent pattern (low SD) supports standardization, while a diverse one (high SD) calls for customization.
Importance of Standard Deviation:
- Measures Data Consistency
Standard deviation is essential for understanding how consistently data values are distributed around the mean. A smaller standard deviation indicates that data points are closely clustered, reflecting stability. Conversely, a larger standard deviation shows higher variability. This insight is vital in analyzing employee performance, academic results, or machine output, where consistency is a key indicator of quality, reliability, and process control.
- Supports Statistical Decision-Making
Standard deviation plays a crucial role in decision-making by quantifying uncertainty and variability. It helps in determining whether data is tightly grouped or widely spread, influencing confidence in conclusions. Whether it’s launching a new product, setting process limits, or analyzing market volatility, standard deviation provides a numerical basis for making sound decisions under uncertainty and evaluating potential risks or outcomes.
- Enables Risk Assessment
In financial and business contexts, standard deviation is widely used to assess investment risk. It shows how much an asset’s return deviates from its expected average, helping investors judge volatility. A high standard deviation signals greater uncertainty and potential loss, while a low one indicates stable performance. This supports portfolio balancing and enables more informed choices in finance and investment planning.
- Facilitates Performance Evaluation
Standard deviation is valuable in evaluating individual or group performance. For example, in education, it helps understand how students’ marks vary from the average, indicating whether teaching methods are effective. Similarly, in business, it measures variation in employee productivity, sales figures, or customer service ratings. These insights guide improvements and performance appraisals, ensuring decisions are based on consistent data.
- Assists in Quality Control
In manufacturing, standard deviation helps monitor process variation and maintain product quality. It ensures that items produced conform to specifications by identifying inconsistencies. Quality control charts often use standard deviation to set upper and lower control limits. If the variation exceeds the expected standard deviation range, corrective action is taken. This reduces defects, increases efficiency, and enhances customer satisfaction.
- Aids in Forecasting and Planning
Standard deviation supports accurate forecasting by evaluating historical data variability. In areas like sales projections, demand analysis, and weather predictions, it reveals how much future values are likely to deviate from the average. Planners use this to account for uncertainties and build flexible strategies. A low standard deviation indicates predictability, while a high one calls for contingency plans and buffer provisions.
- Foundation for Advanced Statistics
Standard deviation is foundational for numerous statistical tools like z-scores, confidence intervals, hypothesis testing, and regression analysis. It helps measure standard error, analyze distributions, and calculate probabilities. Advanced models in data science and machine learning also rely on it to detect patterns, outliers, and trends. Its accuracy and comprehensiveness make it indispensable in statistical theory and applications.
- Enhances Comparability
Standard deviation enhances the comparability of datasets by showing how much variation exists relative to the mean. When combined with the coefficient of variation, it allows comparisons across datasets with different units or scales. This helps in comparing company performance, market stability, or academic achievement between different groups, enabling clear and fair analysis based on consistency and variability.
Coefficients of Standard Deviation:
The Coefficient of Standard Deviation is a relative measure of dispersion that expresses standard deviation in proportion to the mean of the data. It allows us to compare the variability of two or more datasets regardless of units or scale.
While standard deviation tells us the absolute dispersion (in original units), the coefficient of standard deviation provides a unit-free ratio, which is especially helpful for comparing consistency across different datasets.
Formula
Coefficient of Standard Deviation (CSD) =σ / Xˉ
Interpretation of Coefficients of Standard Deviation:
-
Lower coefficient = More consistency (less variability)
-
Higher coefficient = Less consistency (more variability)
It’s useful when comparing:
-
Two production machines
-
Exam results across subjects
-
Price variation in different markets
-
Returns of two investment options
Variance
Another statistical term that is related to the distribution is the variance, which is the standard deviation squared (variance = SD² ). The SD may be either positive or negative in value because it is calculated as a square root, which can be either positive or negative. By squaring the SD, the problem of signs is eliminated. One common application of the variance is its use in the F-test to compare the variance of two methods and determine whether there is a statistically significant difference in the imprecision between the methods.
In many applications, however, the SD is often preferred because it is expressed in the same concentration units as the data. Using the SD, it is possible to predict the range of control values that should be observed if the method remains stable. As discussed in an earlier lesson, laboratorians often use the SD to impose “gates” on the expected normal distribution of control values.
Coefficient of Variation
Another way to describe the variation of a test is calculate the coefficient of variation, or CV. The CV expresses the variation as a percentage of the mean, and is calculated as follows:
CV% = (SD/Xbar)100
In the laboratory, the CV is preferred when the SD increases in proportion to concentration. For example, the data from a replication experiment may show an SD of 4 units at a concentration of 100 units and an SD of 8 units at a concentration of 200 units. The CVs are 4.0% at both levels and the CV is more useful than the SD for describing method performance at concentrations in between. However, not all tests will demonstrate imprecision that is constant in terms of CV. For some tests, the SD may be constant over the analytical range.
The CV also provides a general “feeling” about the performance of a method. CVs of 5% or less generally give us a feeling of good method performance, whereas CVs of 10% and higher sound bad. However, you should look carefully at the mean value before judging a CV. At very low concentrations, the CV may be high and at high concentrations the CV may be low. For example, a bilirubin test with an SD of 0.1 mg/dL at a mean value of 0.5 mg/dL has a CV of 20%, whereas an SD of 1.0 mg/dL at a concentration of 20 mg/dL corresponds to a CV of 5.0%.