 by
by Standard Deviation
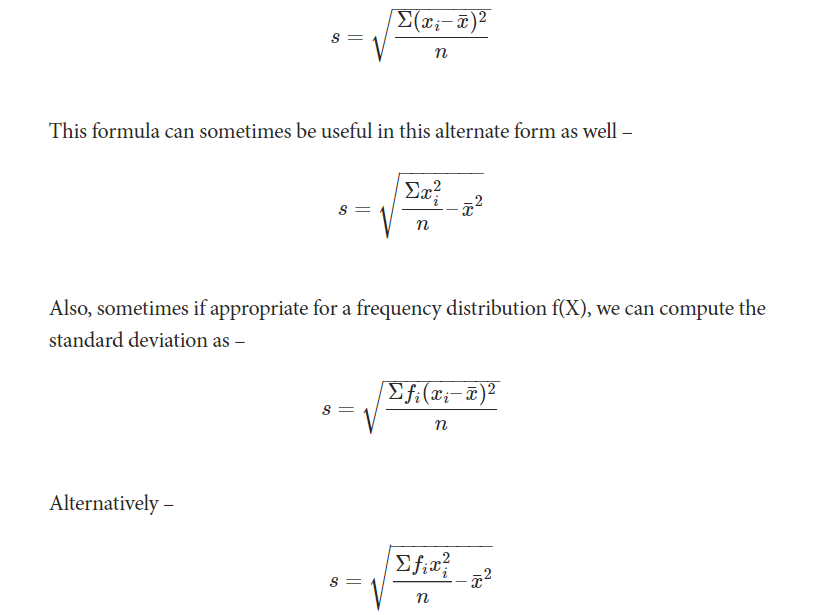
As the name suggests, this quantity is a standard measure of the deviation of the entire data in any distribution. Usually represented by s or σ. It uses the arithmetic mean of the distribution as the reference point and normalizes the deviation of all the data values from this mean.
Therefore, we define the formula for the standard deviation of the distribution of a variable X with n data points as:
Mean Deviation
Mean Deviation, also known as Average Deviation, is a measure of dispersion that shows the average of absolute differences between each data point and a central value (such as the mean, median, or mode). It helps in understanding how much, on average, the data values deviate from the center, ignoring the direction of deviation (positive or negative).
Key Concept of Mean Deviation:
- Unlike standard deviation, which squares the differences, mean deviation takes the absolute value.
- It provides a simpler and more intuitive measure of variation.
- Suitable for both grouped and ungrouped data.
Mean deviation = Sum of absolute values of deviations from ‘a’ ÷ The number of observations
Features of Mean Deviation:
- Based on All Observations
Mean deviation is calculated using every data point in a dataset. Unlike range or quartile deviation, which rely only on a portion of the data, mean deviation considers the absolute deviation of each value from a central tendency. This provides a more comprehensive and accurate measure of dispersion, ensuring that no individual observation is ignored during the calculation of variability.
- Uses Absolute Differences
Mean deviation focuses on the absolute values of deviations, which means it does not consider whether the differences are positive or negative. By converting all deviations to positive values, it avoids the issue of cancellation that can occur with raw differences. This leads to a clearer understanding of the average distance from the central value without being skewed by direction.
- Simpler than Standard Deviation
One of the most notable features of mean deviation is its simplicity in both concept and computation. It does not involve squaring or taking the square root of deviations, as in the case of standard deviation. This makes it easier to understand and calculate, especially for beginners or in situations where a quick estimate of variability is needed.
- Can Be Calculated from Mean, Median or Mode
Unlike standard deviation, which is always calculated from the mean, mean deviation can be computed using the mean, median, or mode as the central value. This flexibility allows statisticians to choose the most appropriate measure of central tendency based on the nature of the data, particularly in cases of skewed distributions where the median may be more representative.
- Less Affected by Extreme Values
Since mean deviation uses absolute differences and avoids squaring, it is less influenced by outliers than standard deviation. While it still accounts for every data point, it does not exaggerate the impact of very large or small values. This makes mean deviation more reliable when dealing with datasets that contain a few extreme observations.
- Suitable for Preliminary Data Analysis
Mean deviation is an excellent tool for initial exploration of datasets. Its straightforward calculation and interpretation help in identifying basic patterns in variability before using more complex statistical techniques. It provides quick insights into how spread out the values are, making it useful in surveys, quality checks, and small-scale studies.
- Not Algebraically Tractable
Despite its simplicity, mean deviation has a limitation—it is not easily used in algebraic or advanced statistical calculations. Unlike standard deviation, it cannot be integrated into further mathematical models such as regression or analysis of variance. Therefore, its application is primarily confined to descriptive statistics and basic comparisons.
- Expressed in the Same Units as Data
Mean deviation is always expressed in the same unit as the original data, whether it’s kilograms, rupees, hours, or any other measurement. This consistency in units makes interpretation easy and practical. For example, if the mean deviation of monthly income is ₹500, it directly indicates the average variation in rupees, enhancing clarity in communication and decision-making.
Scope of Mean Deviation:
- Educational Performance Analysis
Mean deviation plays a vital role in assessing student performance consistency. By calculating how much students’ scores deviate from the class average or median, schools and educators can evaluate teaching effectiveness and student understanding. It is especially useful for identifying performance gaps and planning targeted interventions for low or high achievers to ensure a more balanced academic outcome.
- Economic Inequality Measurement
Economists use mean deviation to assess variability in income, consumption, and savings among individuals or regions. It provides a clear measure of how far economic variables deviate from the national or state average, helping to gauge inequality levels. Though not as widely used as the Gini coefficient, mean deviation still offers a basic yet insightful view of disparities in economic conditions.
- Business and Financial Analysis
In business and finance, mean deviation helps in measuring volatility in revenues, costs, and investment returns. It provides an average measure of how far a value deviates from the expected figure, assisting in financial forecasting, budgeting, and decision-making. Businesses can use this to monitor profit stability and investor behavior, and to evaluate risk in financial markets or portfolios.
- Industrial and Quality Control
Industries use mean deviation to evaluate consistency in product dimensions, weights, and quality standards. By calculating average deviations from the standard specifications, production units can identify machinery errors, maintain uniformity, and reduce defects. It acts as a basic tool for ensuring quality assurance and maintaining customer satisfaction through controlled and consistent manufacturing processes.
- Public Health and Medical Studies
In healthcare, mean deviation supports the analysis of variability in patient health parameters like blood pressure, heart rate, or glucose levels. Hospitals and researchers use it to assess how consistently patients respond to treatments. A smaller mean deviation in medical outcomes can indicate effective treatment plans, while higher deviation may suggest varied reactions requiring further investigation.
- Social Research and Demography
Social scientists apply mean deviation to evaluate variations in literacy rates, population density, and household expenditure across regions or groups. It helps in highlighting disparities in access to resources or opportunities. This statistical insight aids in policymaking, resource allocation, and the creation of development programs aimed at reducing social and regional inequalities.
- Environmental and Climate Studies
Environmental researchers use mean deviation to measure climatic variability, such as temperature, rainfall, or air pollution levels. It provides a summary of how weather conditions deviate from the average, helping to identify patterns of climate change, seasonal shifts, or abnormal environmental conditions. These findings can be critical for planning agricultural activities and natural disaster preparedness.
- Sports and Performance Metrics
In sports analytics, mean deviation is used to examine consistency in athletic performance. By analyzing deviations from average scores or times, coaches and trainers can monitor progress, identify areas for improvement, and evaluate the reliability of players. A smaller mean deviation implies consistent performance, making it an important metric in team selection and performance forecasting.
Applications of Mean Deviation:
- Educational Performance Analysis
Mean deviation is used in the education sector to assess the consistency of student performance. By calculating the average deviation of marks from the class average or median, schools can evaluate whether most students perform close to the norm or if results are widely scattered. It helps in designing remedial teaching strategies, measuring the effectiveness of teaching methods, and ensuring equitable learning outcomes.
- Business Cost and Revenue Analysis
Businesses use mean deviation to measure fluctuations in costs or revenues over a period. For example, by computing the mean deviation of monthly sales or production expenses, companies can analyze the stability of their financial performance. A smaller mean deviation indicates consistent income or expenditure, which supports better financial planning and resource allocation, while larger deviations may indicate risk or inefficiencies.
- Stock Market and Investment Evaluation
In finance, mean deviation can be applied to analyze stock returns or investment yields. Investors use it to estimate the average deviation of a stock’s return from its mean return, offering a basic idea of risk. Though standard deviation is more common in risk assessment, mean deviation still serves as a quick and simple method to determine how predictable an asset’s performance is over time.
- Quality Control in Manufacturing
Manufacturing industries use mean deviation to measure variability in product quality or machine performance. By analyzing the deviations in weight, size, or other parameters from the standard, managers can detect whether the production process is consistent. It helps identify irregularities and maintain product standards, ensuring customer satisfaction and reducing rework or waste in the production line.
- Social and Economic Studies
In the fields of sociology and economics, mean deviation helps assess variability in income, employment rates, or consumption patterns across regions or populations. For instance, researchers can use it to understand how far individual incomes deviate from the average in a society, thus offering insights into economic inequality or disparities in living standards.
- Climate and Weather Pattern Analysis
Meteorologists use mean deviation to analyze variations in temperature, rainfall, or humidity from their average values. It allows them to measure how stable or volatile the climate is over a period. For example, the mean deviation of daily temperatures over a month helps detect abnormal weather conditions or seasonal changes, which can be crucial for agriculture and disaster preparedness.
- Healthcare and Patient Monitoring
Mean deviation is used in the healthcare sector to monitor patient health metrics such as blood pressure, glucose levels, or pulse rates. By comparing daily readings to the average, medical professionals can assess the stability of a patient’s condition. This helps in diagnosing abnormalities early, adjusting treatments, and ensuring better outcomes through consistent monitoring.
- Sports and Athlete Performance
In sports analytics, mean deviation helps in evaluating athlete performance consistency. For instance, if a cricketer scores between 40 and 60 runs in every match, the mean deviation from their average will be small, indicating consistent performance. Coaches and analysts use this data to make team decisions, measure progress, and design training programs.
Merits of Mean Deviation:
- Simplicity in Calculation
Mean deviation is easy to understand and calculate. Unlike standard deviation, which involves squaring and taking square roots, mean deviation only requires the average of absolute differences from a central value. This makes it suitable for students, beginners in statistics, and situations where a quick measure of spread is needed without complex computations. It is especially helpful in basic statistical analysis and survey reporting.
- Based on All Observations
One of the major merits of mean deviation is that it considers every observation in the dataset. This ensures that the measure reflects the entire distribution, rather than focusing only on extreme values (as in range) or a middle portion (as in quartile deviation). As a result, it provides a more comprehensive picture of dispersion than simpler or partial measures.
- Measures Average Variability
Mean deviation provides a clear picture of how far data points deviate from the average. By taking the mean of absolute deviations, it effectively captures the average spread in the data. This makes it particularly useful in understanding consistency in performance, quality control, or fluctuations in income, sales, or environmental conditions.
- Less Affected by Extreme Values Than Standard Deviation
Unlike standard deviation, mean deviation does not square the deviations, so it is less influenced by extreme values or outliers. This gives it an edge in datasets where some values deviate widely from the center. Although it still includes all observations, the absence of squaring keeps the influence of extreme data points in check, providing a more balanced view.
- Applicable to Both Discrete and Continuous Data
Mean deviation can be used with both discrete data (individual values) and continuous data (grouped in intervals). It is a versatile measure applicable to various statistical formats, whether raw data, frequency distributions, or grouped tables. This flexibility makes it suitable across disciplines like economics, education, health, and engineering.
- Expressed in Original Units
Since mean deviation is expressed in the same units as the original data, it is easy to interpret and relate to real-life contexts. For example, if monthly incomes have a mean deviation of ₹800, it clearly indicates that, on average, incomes differ from the mean by ₹800. This directness aids understanding without additional conversions or interpretation.
- Useful for Preliminary Analysis
Mean deviation is a helpful tool for initial or exploratory data analysis. It gives a quick estimate of data variability, making it ideal in the early stages of research or when summarizing descriptive statistics. Researchers often use it as a first step before applying more advanced measures like standard deviation or variance.
- Flexible with Central Tendency Measures
Another important merit is that mean deviation can be calculated from mean, median, or mode, depending on the nature of the data. This flexibility allows the statistician to choose the most suitable central measure for calculating deviation—especially helpful in skewed distributions where the median might provide a more accurate center than the mean.
Demerits of Mean Deviation:
- Ignores the Direction of Deviation
Mean deviation considers only the magnitude of deviations from the central value, not the direction (positive or negative). By taking the absolute value, it removes whether the data point lies above or below the mean or median. This limits the understanding of how values are distributed around the center and eliminates information that could be valuable in deeper analysis.
- Not Algebraically Manageable
Mean deviation is not algebraically tractable, meaning it cannot be easily used in advanced statistical computations. Unlike standard deviation, which has properties suitable for operations like variance addition or regression analysis, mean deviation cannot be manipulated in algebraic equations. This limits its use in mathematical modeling, inferential statistics, and theoretical derivations.
- Less Sensitive to Outliers
While being less affected by extreme values is a merit in some cases, it can also be a drawback. In datasets where extreme observations carry significant importance (like in finance or risk assessment), the mean deviation may underestimate the true variability. In such cases, standard deviation provides a more accurate measure of the spread.
- Difficult to Handle Mathematically
The use of absolute values in mean deviation makes it difficult to perform certain mathematical operations like differentiation and integration. This limitation restricts its application in calculus-based statistical techniques or probability distributions, where algebraic manipulation is necessary for deriving formulas and solving equations.
- Not Commonly Used in Advanced Analysis
In practice, mean deviation is rarely used in advanced statistical analysis. Most statistical software and analytical tools prioritize standard deviation and variance because they have better theoretical foundations and support further analysis like hypothesis testing, confidence intervals, and inferential modeling. Thus, mean deviation has limited practical use in research and applied statistics.
- Ambiguity in Central Value Selection
Mean deviation can be calculated from mean, median, or mode, but this flexibility can also lead to inconsistency and confusion. Different central values may produce different mean deviations for the same data, making it harder to compare datasets. If the wrong central measure is used (especially in skewed data), the results may be misleading or less accurate.
- May Not Reflect True Variability in Skewed Distributions
In highly skewed distributions, mean deviation may fail to reflect the actual spread of values. If the dataset has a long tail or significant asymmetry, relying on the average of absolute differences can give a distorted picture of variability. More sophisticated measures like standard deviation or interquartile range might be more informative in such cases.
- Limited Theoretical Support
Mean deviation lacks the strong theoretical foundation that standard deviation and variance enjoy in probability and inferential statistics. It does not appear in many statistical theorems or distribution properties, making it less useful for building models or deriving probabilistic outcomes. This reduces its credibility and adoption in academic and scientific research.
One thought on “Standard Deviation and Mean Deviation, Concept, Features, Scope, Applications, Merits and Demerits”