 by
by In the Long run, all factors of production, including labor and capital, are variable. This contrasts with the short run, where at least one input (usually capital) is fixed. As a result, firms have the flexibility to adjust the scale of production, optimize the combination of inputs, and build or shut down production facilities. The cost-output relationship in the long run is significantly influenced by economies and diseconomies of scale, which determine how costs change as output increases.
In the long run, firms make decisions about expanding or contracting production capacity based on anticipated demand and costs. They aim to achieve the lowest possible cost per unit of output, known as minimum efficient scale (MES).
Long-Run Costs and Economies of Scale
1. Long-Run Total Cost (LRTC)
Long-run total cost (LRTC) refers to the total cost incurred by a firm when all inputs are variable. Unlike in the short run, where fixed costs remain constant, in the long run, firms can adjust all costs according to the scale of production.
- Example:
A company may build a larger factory in the long run to take advantage of lower production costs per unit, something that cannot be done in the short run.
2. Long-Run Average Cost (LRAC)
Long-run average cost (LRAC) is the cost per unit of output when a firm can adjust all its inputs. The LRAC curve typically exhibits a U-shape, reflecting the presence of economies of scale at lower levels of output and diseconomies of scale at higher levels of output.
- Economies of Scale:
These occur when increasing the scale of production lowers the average cost per unit. Factors contributing to economies of scale include:
-
- Specialization of labor and management
- Technological improvements
- Bulk purchasing of inputs
- Efficient utilization of capital
As a result, the LRAC curve slopes downward when a firm experiences economies of scale.
- Diseconomies of Scale:
These occur when increasing the scale of production raises the average cost per unit. Diseconomies may arise due to:
-
- Inefficiencies in managing a larger workforce
- Communication breakdowns in larger organizations
- Overuse of fixed assets
When diseconomies of scale set in, the LRAC curve slopes upward.
LRAC = LRTC / Q
3. Long-Run Marginal Cost (LRMC)
Long-run marginal cost (LRMC) is the additional cost incurred to produce one more unit of output when all inputs are variable. It is calculated by dividing the change in long-run total cost by the change in output.
LRMC = ΔLRTC / ΔQ
Like the LRAC curve, the LRMC curve also has a U-shape. It initially declines due to economies of scale and rises later due to diseconomies of scale. The LRMC curve intersects the LRAC curve at its minimum point, indicating the optimal scale of production.
Example of Long-Run Cost-Output Relationship
Let’s consider a firm that produces different levels of output by adjusting its plant size and capital. The table below shows the long-run total cost (LRTC), long-run average cost (LRAC), and long-run marginal cost (LRMC) for various output levels.
| Output (Q) | Long-Run Total Cost (LRTC) | Long-Run Average Cost (LRAC) | Long-Run Marginal Cost (LRMC) |
| 100 units | $20,000 | $200 | – |
| 200 units | $35,000 | $175 | $150 |
| 300 units | $45,000 | $150 | $100 |
| 400 units | $50,000 | $125 | $50 |
| 500 units | $55,000 | $110 | $50 |
| 600 units | $65,000 | $108 | $167 |
| 700 units | $85,000 | $121 | $333 |
| 800 units | $110,000 | $137 | $500 |
Analysis of the Table
-
Economies of Scale
As output increases from 100 to 500 units, long-run total cost (LRTC) increases at a decreasing rate. This results in falling LRAC and LRMC. The firm experiences economies of scale, as the cost per unit declines, reflecting greater efficiency in production.
For example, at 100 units, LRAC is $200, and at 500 units, LRAC falls to $110. The decline in costs occurs because of better utilization of resources, specialization, and spreading of fixed costs across a larger number of units.
-
Minimum Efficient Scale
The lowest point on the LRAC curve occurs at 500 units, where LRAC is $110. At this point, the firm has reached its minimum efficient scale (MES), which is the lowest level of output at which the firm achieves minimum long-run average cost. The firm should operate at or near this level to maximize efficiency.
-
Diseconomies of Scale
As output increases beyond 500 units, the firm begins to experience diseconomies of scale. This is evident from the rising LRAC and LRMC. For instance, at 700 units, LRAC rises to $121, and at 800 units, LRAC further increases to $137. The increase in costs is a result of inefficiencies that arise when the scale of production becomes too large, leading to management and coordination problems, as well as overutilization of inputs.
Economies and Diseconomies of Scale
In the long run, firms can take advantage of economies of scale, which lower costs as output increases. The sources of economies of scale include:
- Technical Economies: As firms expand, they can use more efficient technologies or machines, reducing per-unit costs.
- Managerial Economies: Larger firms can afford to employ specialist managers, leading to better organization and reduced costs.
- Financial Economies: Large firms often have better access to finance at lower interest rates compared to smaller firms.
- Purchasing Economies: Firms producing on a larger scale can purchase raw materials in bulk, leading to discounts and lower input costs.
However, if firms grow too large, they may experience diseconomies of scale, where costs rise as output increases. These diseconomies stem from issues like:
- Managerial Inefficiency: As firms grow, it becomes harder to coordinate and manage all departments effectively.
- Overcrowding of Resources: When too many workers or machines are added to a production process, inefficiencies can arise.
- Complexity in Decision Making: Larger firms often face bureaucratic delays, which can slow down operations and increase costs.
Long-Run Cost-Output Relationship and Firm’s Strategy
The long-run cost-output relationship helps firms decide on the optimal scale of production and how to plan for future expansion or contraction. Firms aim to produce at the minimum efficient scale (MES) to take full advantage of economies of scale and minimize average costs.
Firms also use this relationship to assess whether to enter or exit an industry, expand their production capacity, or introduce new technologies. For example, if a firm operates at a higher cost than its competitors due to diseconomies of scale, it may need to downsize or restructure to regain competitiveness.
Graph:
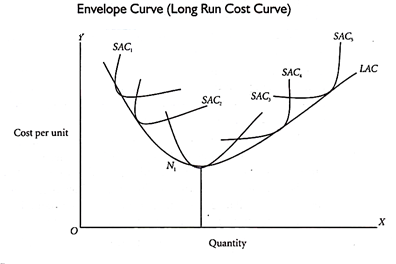

To draw a long-run cost curve, we have to start with a number of short-run average cost curves (SAC curves), each such curve representing a particular scale or size of the plant, including the optimum scale. One can now draw the long-run cost curve which tangential to the entire family of SAC curves, that is, it touches each SAC curve at one point.